Fig. 4.
Download original image
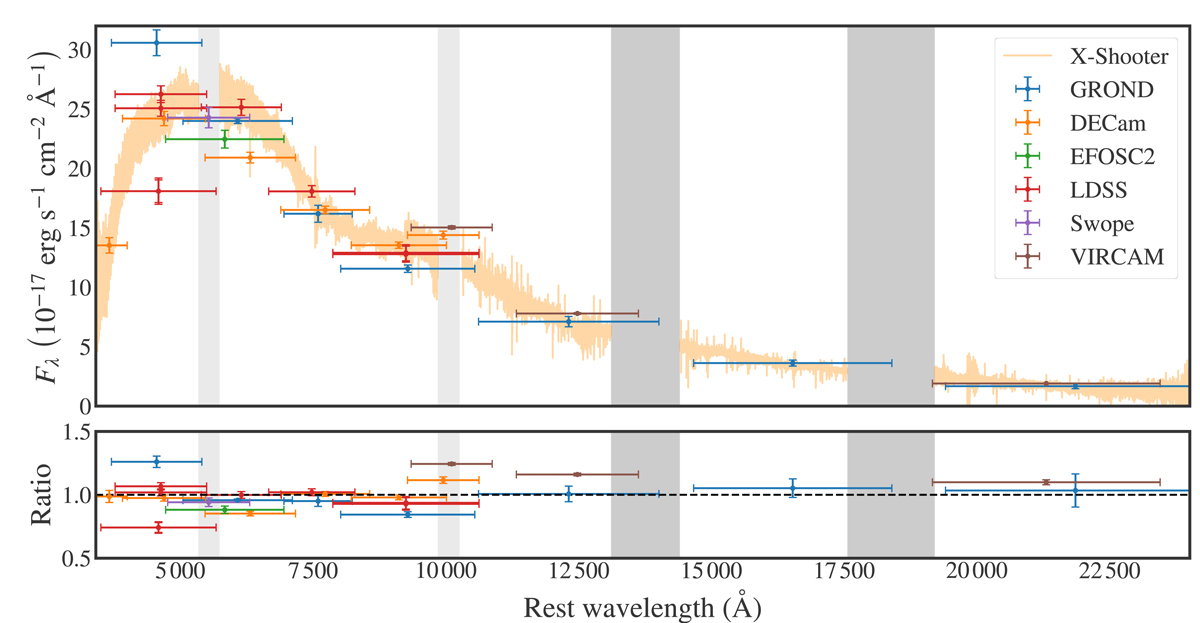
X-shooter spectrum and photometry for the KN AT2017gfo from UV–NIR for observations from 1.35 to 1.45 days after the NS merger GW170817. The dark shaded bars indicate telluric regions; the light shaded bars indicate overlapping noisy regions between the X-shooter UVB, VIS, and NIR arms. The ratio of photometric points to the spectrum (illustrated in the lower panel) shows that while there is significant scatter between photometric points, the normalisation of the spectrum is consistent with the average of the photometric fluxes to within 1%. Data are taken from the literature as follows: GROND and EFOSC2 (Smartt et al. 2017); DECAM (Cowperthwaite et al. 2017); LDSS (Shappee et al. 2017); Swope (Coulter et al. 2017); VIRCAM (Tanvir et al. 2017).
Current usage metrics show cumulative count of Article Views (full-text article views including HTML views, PDF and ePub downloads, according to the available data) and Abstracts Views on Vision4Press platform.
Data correspond to usage on the plateform after 2015. The current usage metrics is available 48-96 hours after online publication and is updated daily on week days.
Initial download of the metrics may take a while.