Fig. 1.
Download original image
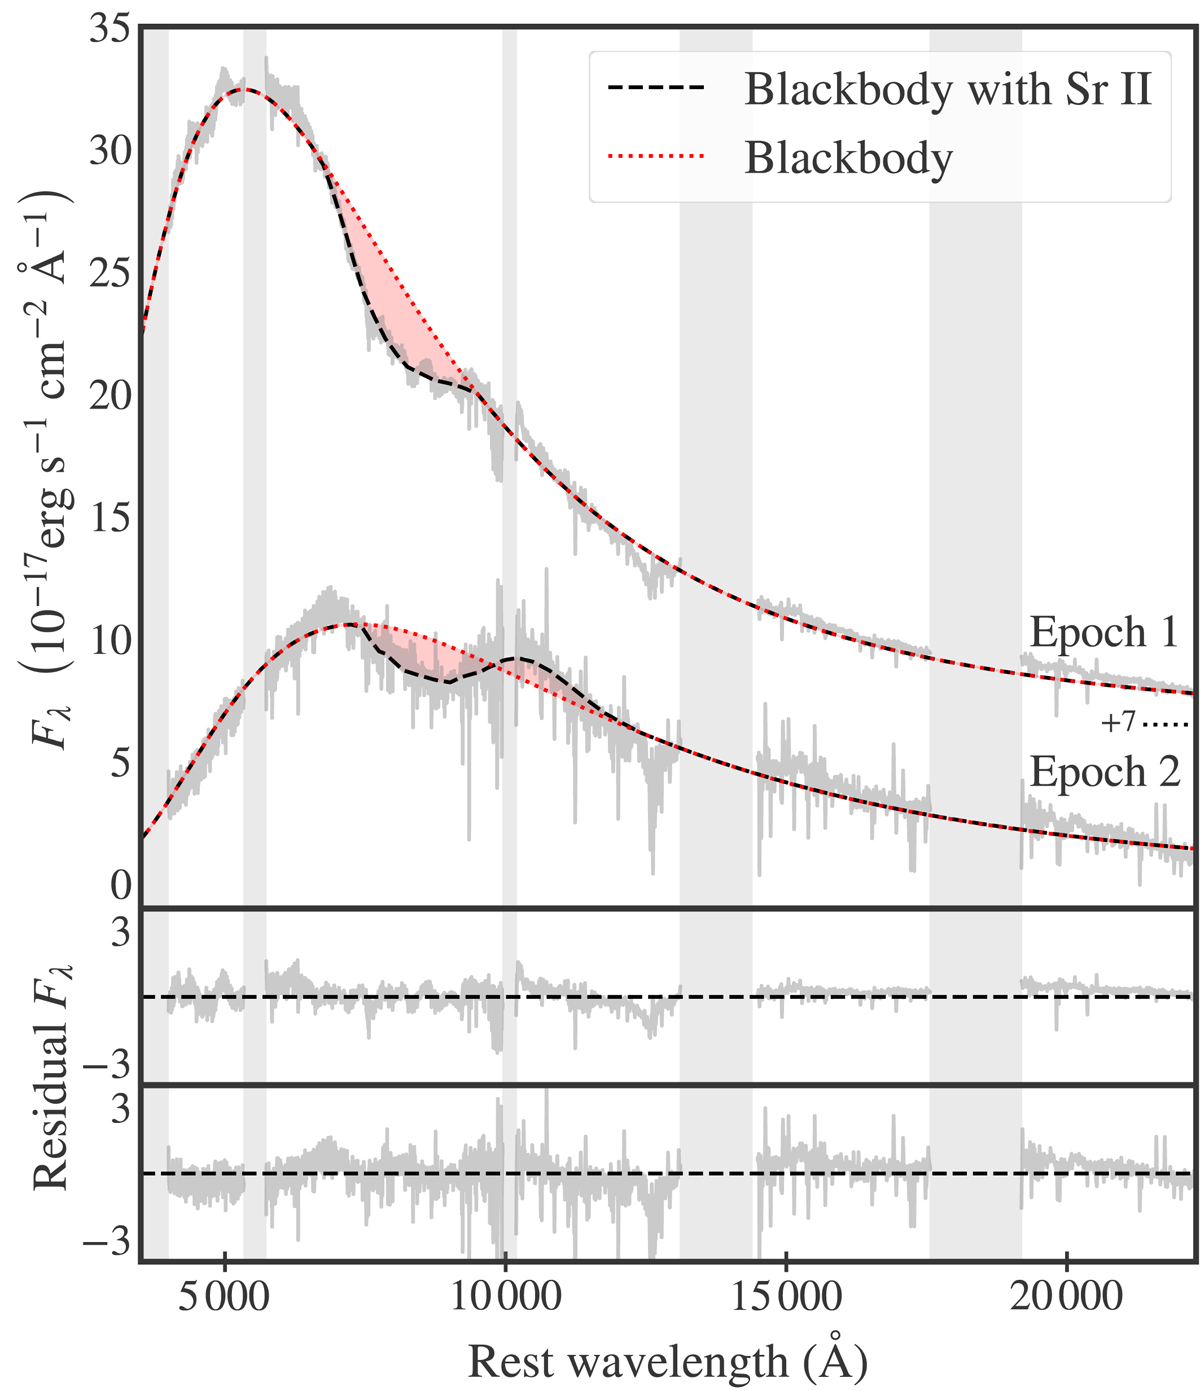
Spectrum and fit of the kilonova AT2017gfo spectrum for epochs 1 and 2 (days +1.43 and +2.42). The dotted line on the right side indicates the offset (7 × 10⁻¹⁷ erg cm−2 s−1 Å−1) added to the first epoch spectrum, the dark shaded bars indicate telluric regions, and the light shaded bars indicate overlapping noisy regions at the edges of the UVB, VIS, and NIR arms.
Current usage metrics show cumulative count of Article Views (full-text article views including HTML views, PDF and ePub downloads, according to the available data) and Abstracts Views on Vision4Press platform.
Data correspond to usage on the plateform after 2015. The current usage metrics is available 48-96 hours after online publication and is updated daily on week days.
Initial download of the metrics may take a while.