Fig. 1.
Download original image
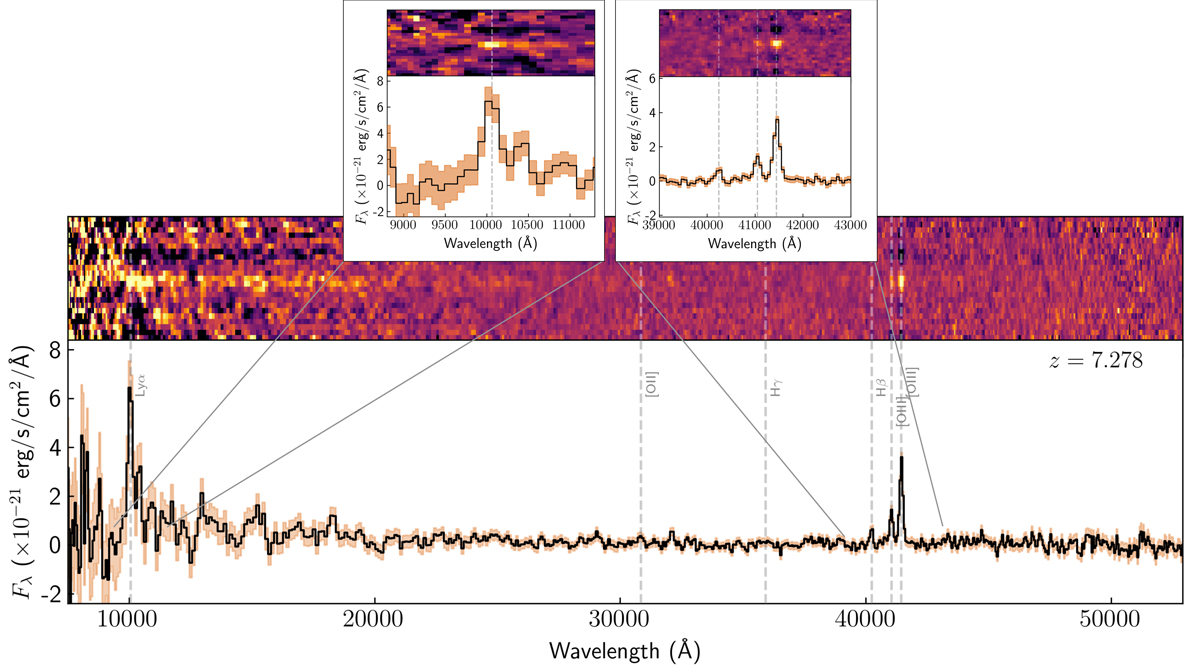
NIRSpec PRISM (R100) spectrum of JADES-GS-z7-LA at z = 7.278, showing both 1D and 2D spectra. The error spectrum has been shown as the orange-shaded region. We additionally show zoom-ins around the Lyα line (top left) and the Hβ, [O III] λ4959 and [O III] λ5007 lines (top right). At least in the PRISM spectrum, the Lyα emission appears at the systemic redshift, indicative of the presence of Lyα (and potentially LyC) escape channels. We caution, however, that at the bluest end of the spectrograph the spectral resolution is much lower than the nominal R ∼ 100, degrading all the way down to R ∼ 30 (Jakobsen et al. 2022).
Current usage metrics show cumulative count of Article Views (full-text article views including HTML views, PDF and ePub downloads, according to the available data) and Abstracts Views on Vision4Press platform.
Data correspond to usage on the plateform after 2015. The current usage metrics is available 48-96 hours after online publication and is updated daily on week days.
Initial download of the metrics may take a while.