Open Access
Fig. 6.
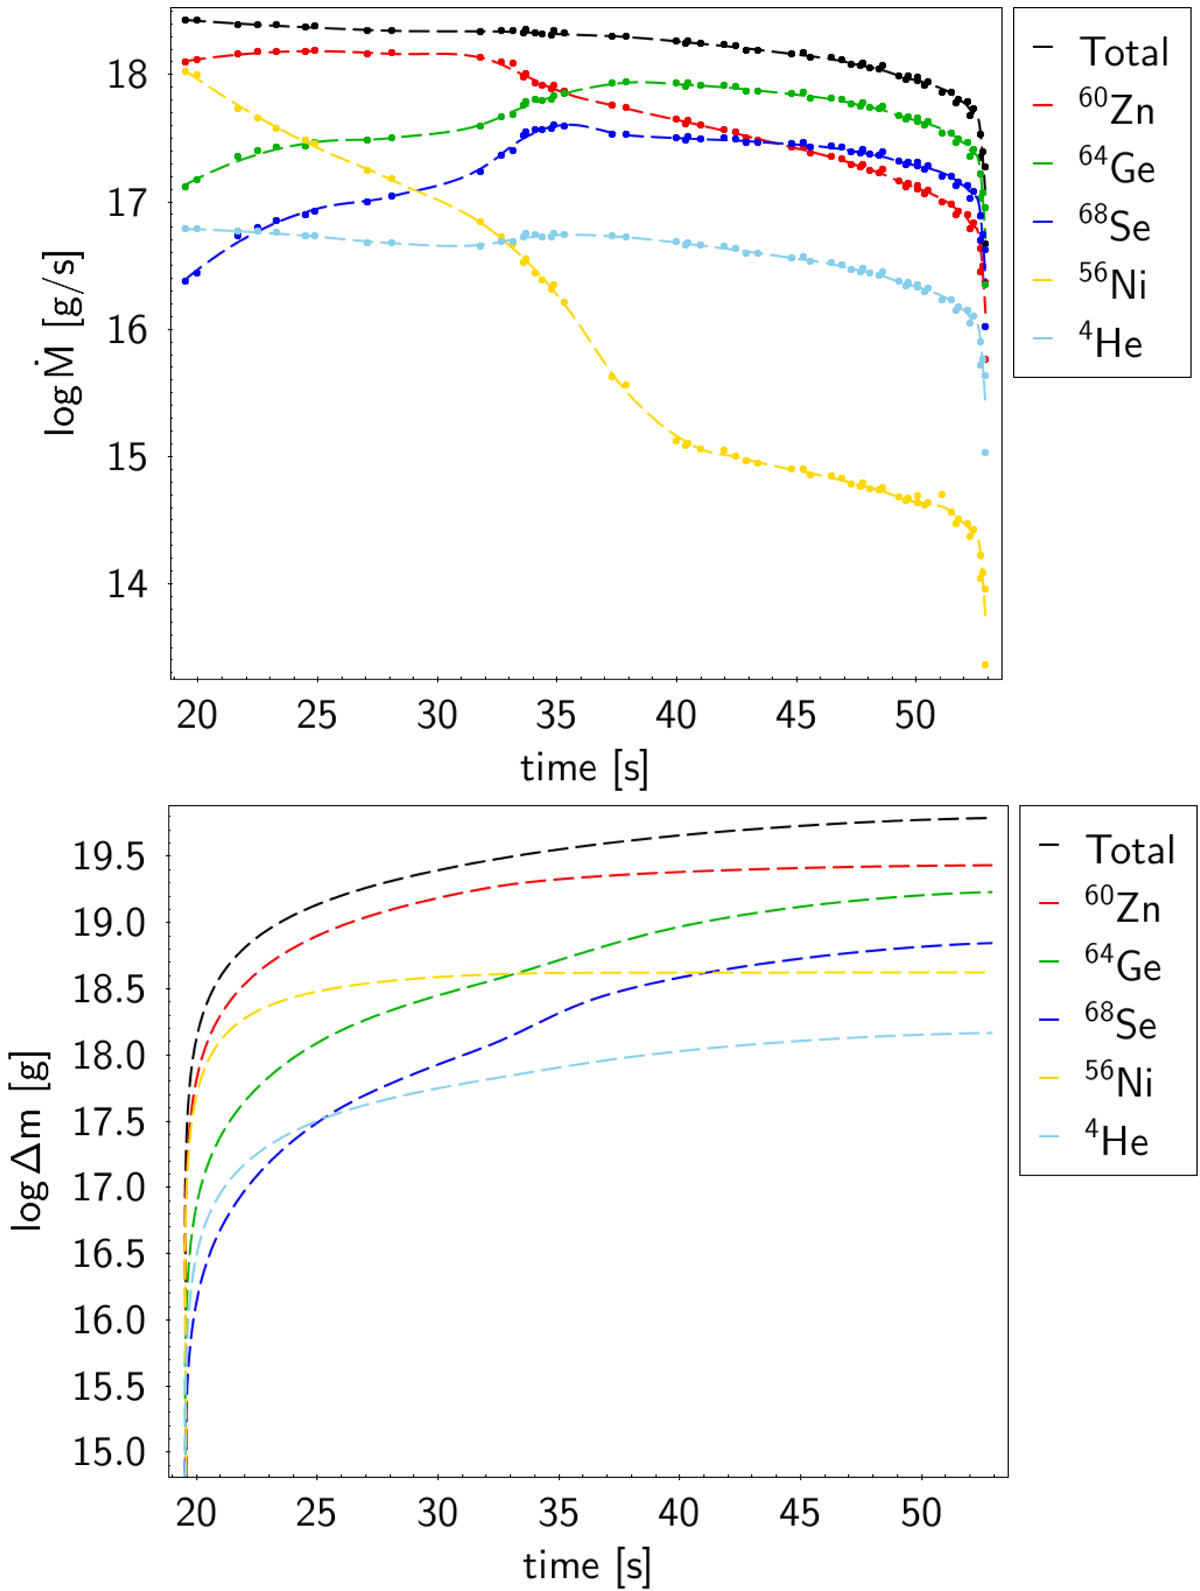
Download original image
Time evolution of mass ejection for the top five species (by ejected mass) in model XRB-A. Top: mass outflow (Ṁ). Bottom: time-integrated ejected mass (Δm). The wind-burst model matching points are indicated with dots and the predictive curves with dashed lines.
Current usage metrics show cumulative count of Article Views (full-text article views including HTML views, PDF and ePub downloads, according to the available data) and Abstracts Views on Vision4Press platform.
Data correspond to usage on the plateform after 2015. The current usage metrics is available 48-96 hours after online publication and is updated daily on week days.
Initial download of the metrics may take a while.