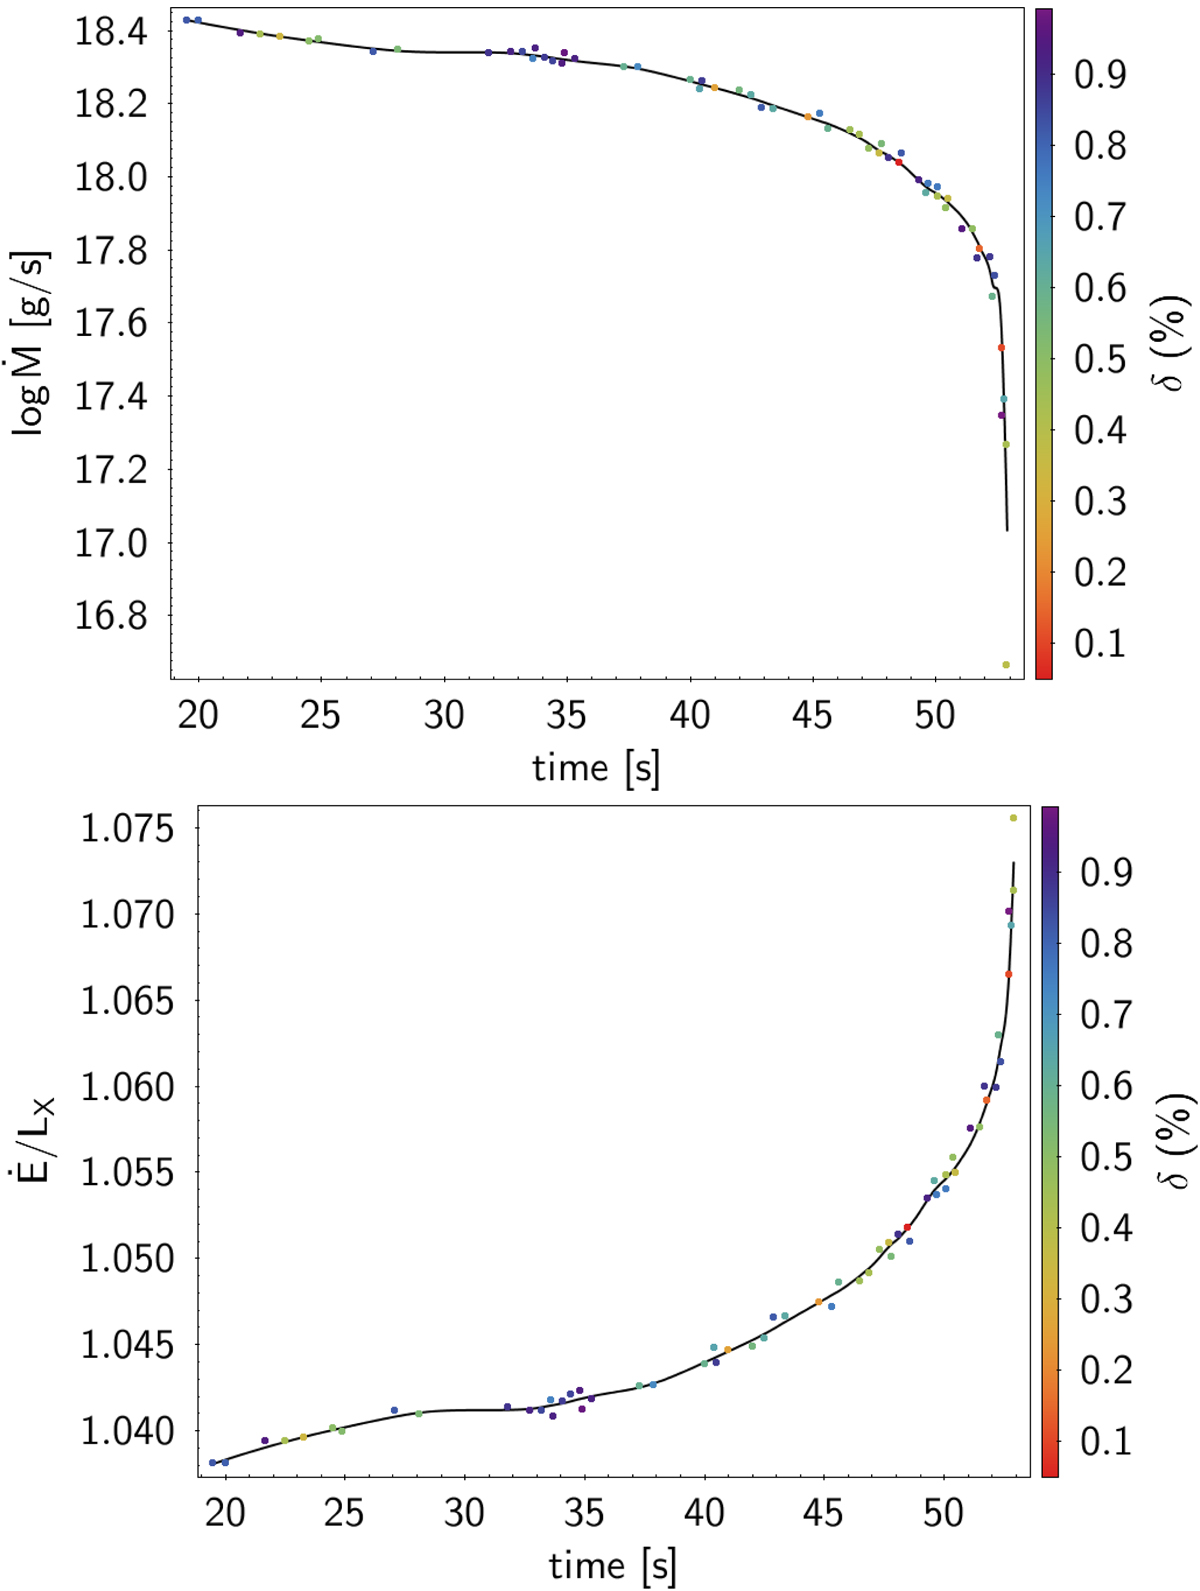
Fig. 5.
Download original image
Time evolution of mass outflow, Ṁ (top), and energy outflow, Ė (bottom), in model XRB-A, and predictive curves using the smoothing-interpolating technique (see text). The wind-burst matching data points are indicated with dots, and predicted values are shown with a line. The color scale indicates the matching error as defined by Eq. (7).
Current usage metrics show cumulative count of Article Views (full-text article views including HTML views, PDF and ePub downloads, according to the available data) and Abstracts Views on Vision4Press platform.
Data correspond to usage on the plateform after 2015. The current usage metrics is available 48-96 hours after online publication and is updated daily on week days.
Initial download of the metrics may take a while.