Fig. 3.
Download original image
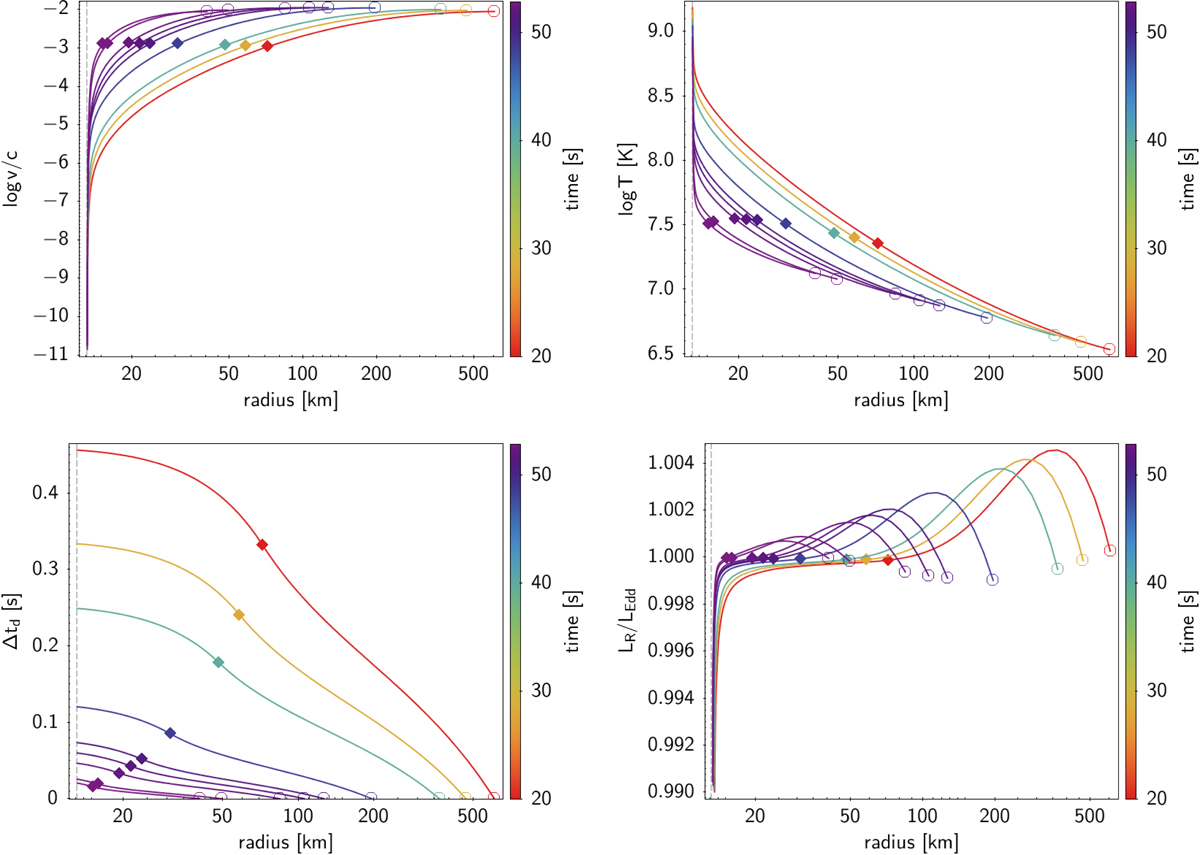
Wind profiles obtained for model XRB-A. The time evolution is indicated by the line color. Locations of the critical sonic point (⬧) and photosphere (°) are indicated in each curve. Panels in reading order are: velocity, temperature, characteristic time, and luminosity ratio Γ (i.e. LR in terms of local Eddington luminosity, LEdd). All plotted as a function of radius. The NS radius is 13.1 km (vertical dashed line).
Current usage metrics show cumulative count of Article Views (full-text article views including HTML views, PDF and ePub downloads, according to the available data) and Abstracts Views on Vision4Press platform.
Data correspond to usage on the plateform after 2015. The current usage metrics is available 48-96 hours after online publication and is updated daily on week days.
Initial download of the metrics may take a while.