Fig. 7.

Download original image
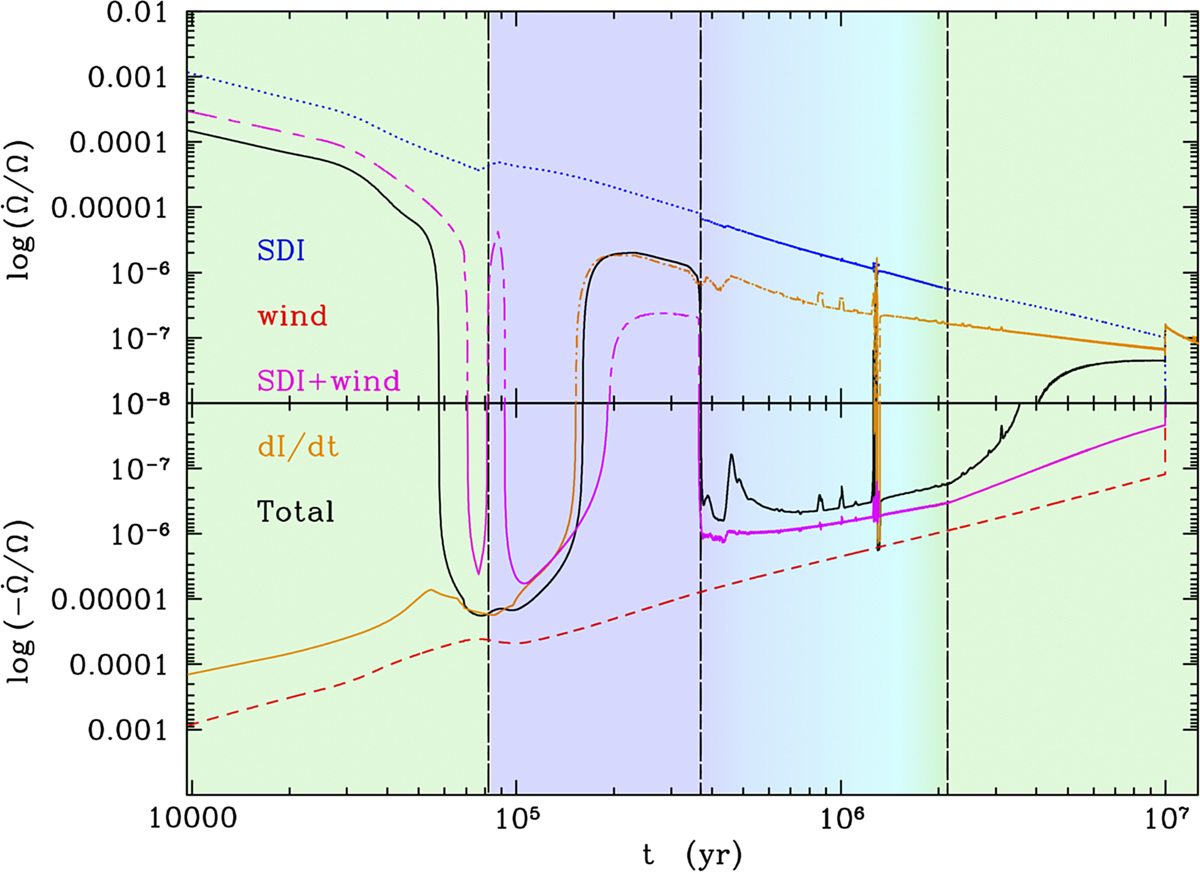
Variation in the rotation rate associated with each torque as a fraction of the current rotation rate per year. The upper (lower) part of the diagram shows a spin-up (spin-down) of the star. The actual change in the rotation rate is shown as a solid black line. The changes associated with the stellar wind and the SDI torque are plotted as dashed red and dotted blue lines, respectively. The variation due to a change in the moment of inertia is shown as the orange line. The background colours indicate the state of the star-disc interaction. States 1 and 2 are shown in purple and green, respectively. The light blue region with a gradient indicates a long-lived phase when the system remains close to the transition between states 1 and 2 and switches frequently between the two states. This model does not reach state 3.
Current usage metrics show cumulative count of Article Views (full-text article views including HTML views, PDF and ePub downloads, according to the available data) and Abstracts Views on Vision4Press platform.
Data correspond to usage on the plateform after 2015. The current usage metrics is available 48-96 hours after online publication and is updated daily on week days.
Initial download of the metrics may take a while.


