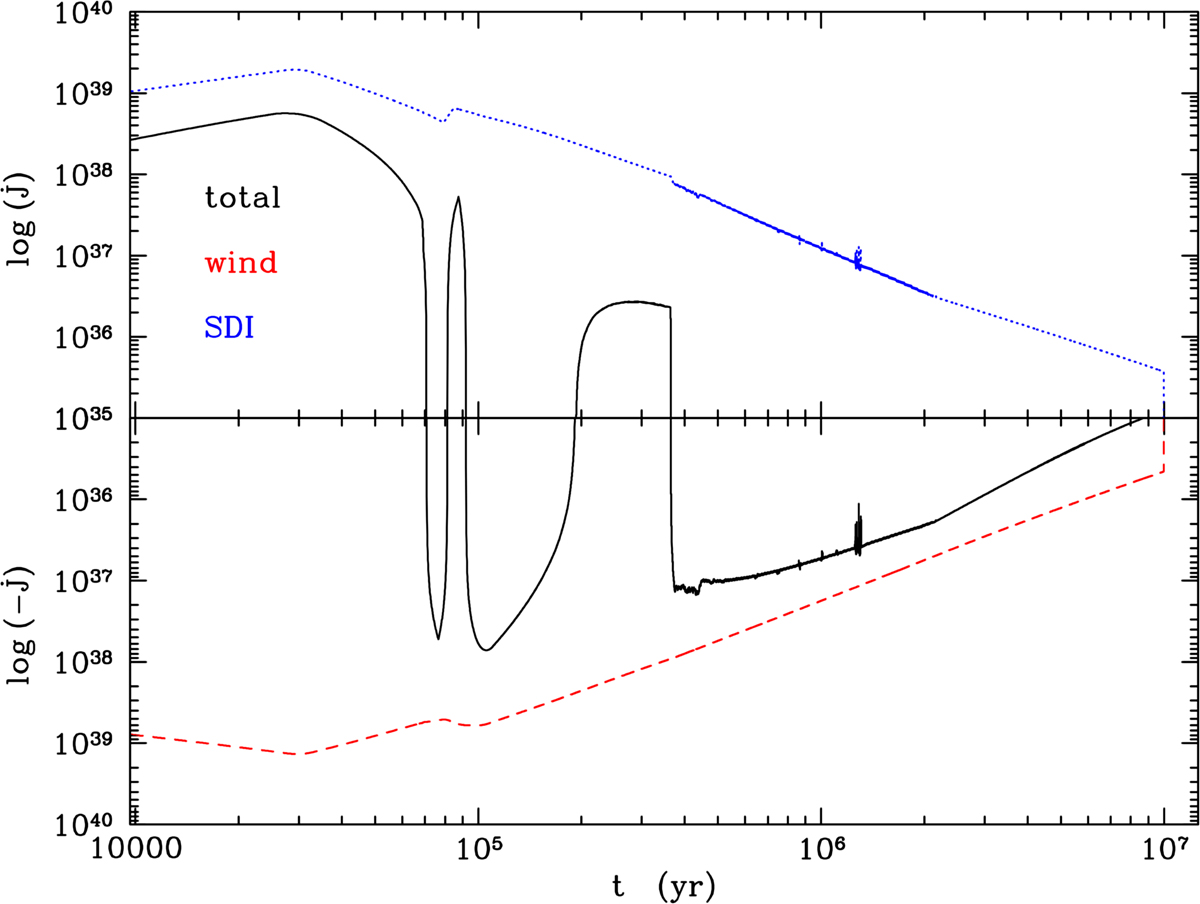
Fig. 6.
Download original image
Torques guiding the evolution of the stellar angular momentum as a function of time for the reference model in g cm2 s−2. The upper (lower) part of the diagram shows a spin-up (spin-down) torque applied on the star. The total torque is shown by the solid black line, the stellar wind torque is plotted as the dashed red line, and the torque due to the SDI interaction (sum of the accretion and ME torques) is shown by the dotted blue line.
Current usage metrics show cumulative count of Article Views (full-text article views including HTML views, PDF and ePub downloads, according to the available data) and Abstracts Views on Vision4Press platform.
Data correspond to usage on the plateform after 2015. The current usage metrics is available 48-96 hours after online publication and is updated daily on week days.
Initial download of the metrics may take a while.