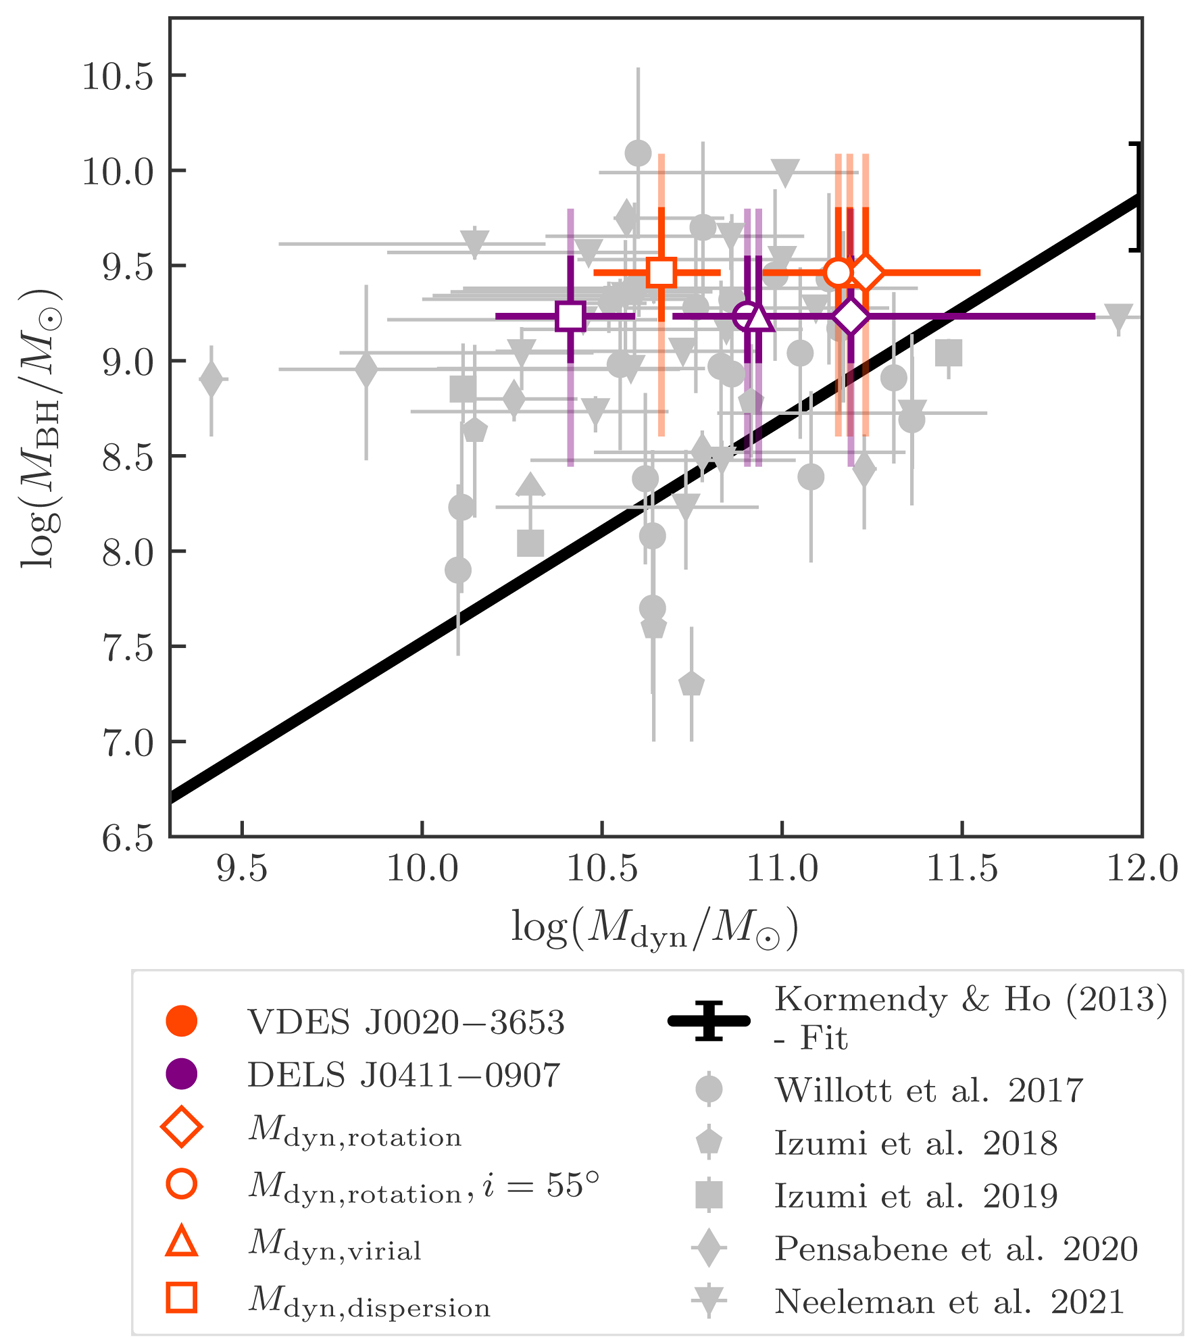
Fig. 9.
Download original image
Dynamical mass–black hole mass relation. Our two quasars DELS J0411–0907 (purple) and VDES J0020–3653 (orange) are shown, with the four Mdyn estimates, Mdyn, rotation, Mdyn, rotation assuming an inclination angle of 55°, Mdyn, dispersion and Mdyn, virial. The solid black hole mass error bars show the 1σ uncertainty on our best estimate of the black hole mass, while the transparent error bars very conservatively show the range of the lower limit of the lowest mass estimate to the upper limit of the largest mass estimate. The black line shows the local Kormendy & Ho (2013) relation. The grey points show a range of observations of high-z quasars as measured via their cold gas from ALMA (Willott et al. 2017; Izumi et al. 2018, 2019; Pensabene et al. 2020; Neeleman et al. 2021).
Current usage metrics show cumulative count of Article Views (full-text article views including HTML views, PDF and ePub downloads, according to the available data) and Abstracts Views on Vision4Press platform.
Data correspond to usage on the plateform after 2015. The current usage metrics is available 48-96 hours after online publication and is updated daily on week days.
Initial download of the metrics may take a while.