Fig. 8.
Download original image
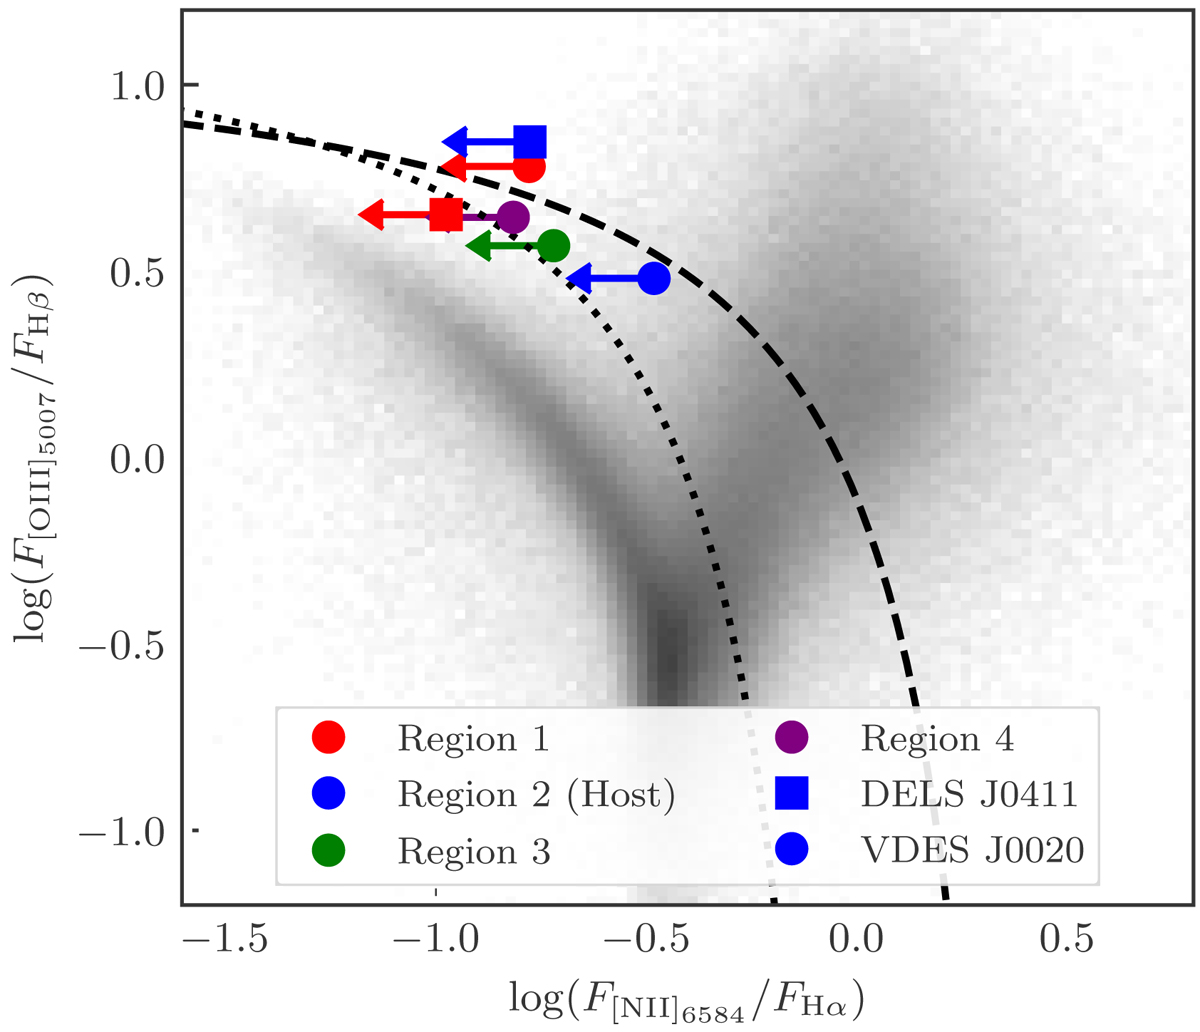
BPT diagnostic diagram showing the flux ratios of the various emission regions for DELS J0411–0907 (squares) and VDES J0020–3653 (circles); the F[N II]λ6584 Å/FHα ratios are all upper limits due to a non-detection of [N II] λ6583. The different colours represent the different emission regions, following the colour scheme in Figs. 5 and 7. The flux ratios were measured from the BLR-subtracted cube. For reference, we show the Kauffmann et al. (2003, black dotted) and Kewley et al. (2001, black dashed) curves which attempt to differentiate between galaxies primarily ionised by star formation (lower left) and AGN (upper right) at low-z. We also show local sources from the SDSS (Abazajian et al. 2009) as the 2D histogram, for comparison.
Current usage metrics show cumulative count of Article Views (full-text article views including HTML views, PDF and ePub downloads, according to the available data) and Abstracts Views on Vision4Press platform.
Data correspond to usage on the plateform after 2015. The current usage metrics is available 48-96 hours after online publication and is updated daily on week days.
Initial download of the metrics may take a while.