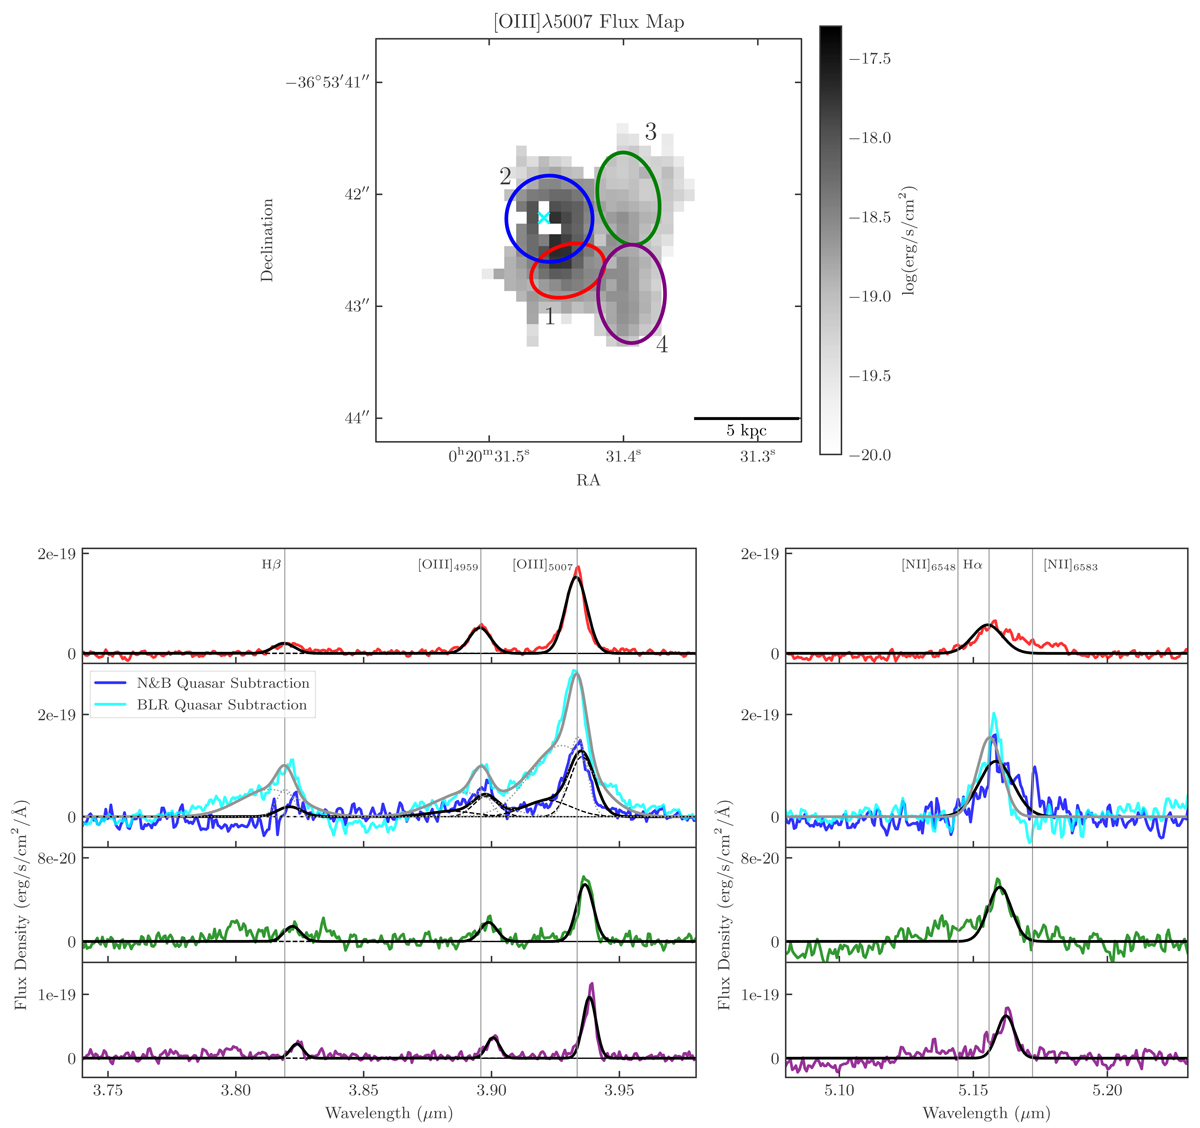
Fig. 7.
Download original image
Emission line regions surrounding VDES J0020–3653. Top: the [O III] λ5007 flux map for VDES J0020–3653 after N&B quasar subtraction, with four regions of interest marked. Bottom: the integrated spectrum for the four regions (coloured lines), along with our best fit model in black. The middle panel, for Region 2, also shows the integrated spectra from the BLR quasar subtraction, in cyan, with the best fit model in grey. This region is the host of the quasar (position marked as a cyan cross in the top panel), and so the residual spectrum in this region depends heavily on the type of quasar subtraction. We note that to account for the overlapping area between Regions 1 and 2, we assigned the flux in those spaxels to Region 1 only. For Region 2, we excluded the central nine pixels surrounding the quasar peak, as these are highly corrupted by the quasar subtraction and introduce significant noise and artefacts. This means that we slightly underestimate the total flux in this region, however the fluxes are significantly more reliable than if these nine most corrupted spaxels were included. In Regions 1, 3, and 4, the spectral lines can be described by a single narrow Gaussian (GN), whereas in Region 2 there is also a broader component which we fit with a second Gaussian (GB); these separate components can be seen as the dashed black lines for the N&B quasar subtraction, and dotted grey lines for the BLR quasar subtraction. We note that the emission around 3.8 μm in Regions 3 and 4 is likely an artefact in the cube. We did not see any significant detection of [N II] λλ6548, 6583.
Current usage metrics show cumulative count of Article Views (full-text article views including HTML views, PDF and ePub downloads, according to the available data) and Abstracts Views on Vision4Press platform.
Data correspond to usage on the plateform after 2015. The current usage metrics is available 48-96 hours after online publication and is updated daily on week days.
Initial download of the metrics may take a while.