Fig. 3.
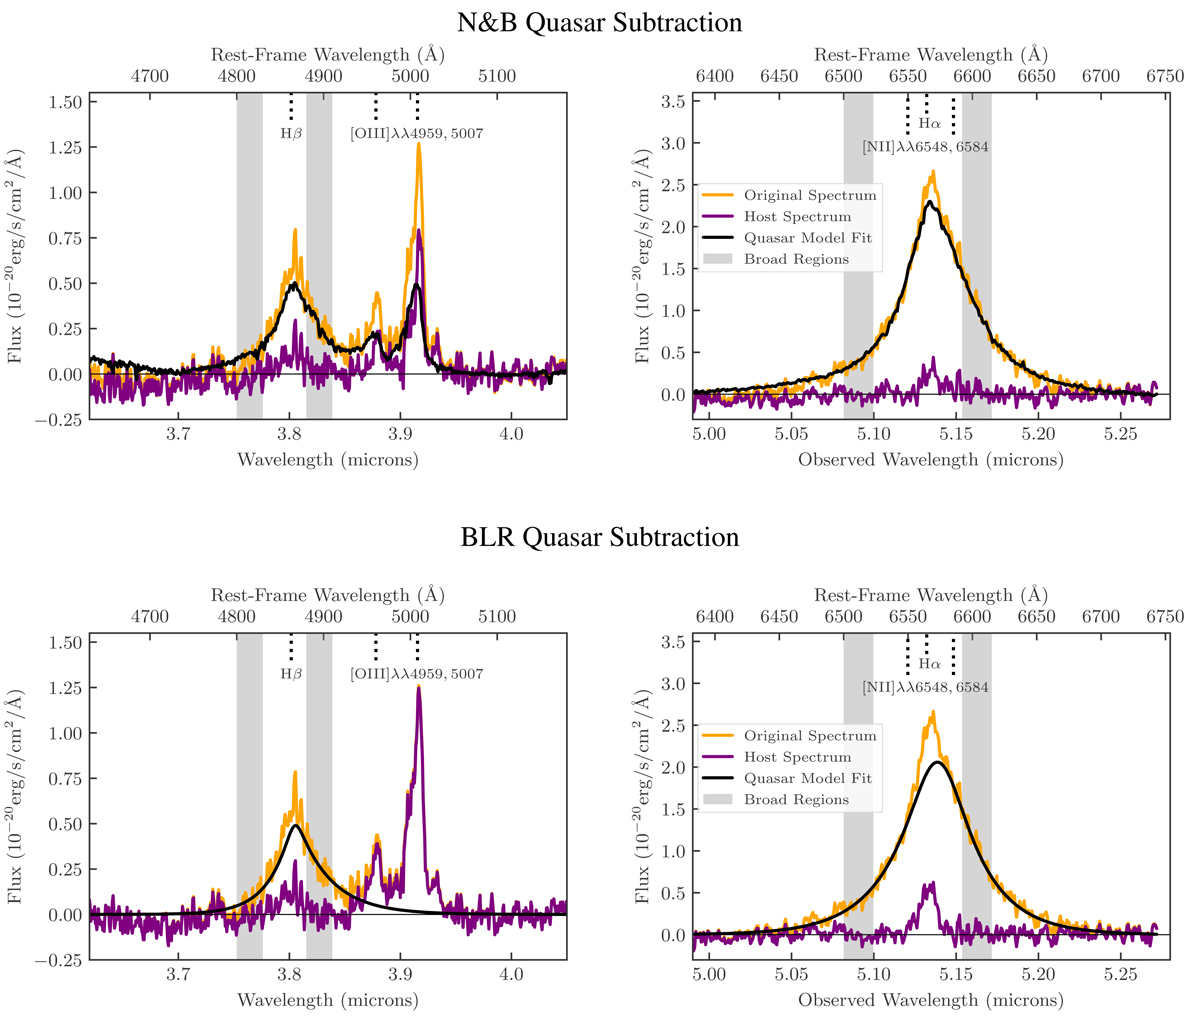
Download original image
Visualisation of the quasar subtraction using the broad Hβ (left) and Hα (right) lines from DELS J0411–0907. This shows the spectrum in spaxel (23, 24), with the quasar peak located at spaxel (26, 24), in image coordinates. The orange spectrum is the original continuum-subtracted spectrum in the spaxel, containing line flux from both the quasar and host galaxy. The black line is the quasar model spectrum. The top panels show the choice that the quasar model spectrum is that of the central brightest quasar spaxel, which contains both narrow and broad emission – the N&B subtraction. The bottom panel shows the choice that the quasar model spectrum is the BLR component from our best-fit model to the quasar spectrum (Fig. 2) – the BLR subtraction. Using the broad spectral windows marked in grey, the quasar model (black) was scaled to fit the combined spectrum (orange). The purple spectrum shows the residual to that fit, which is the host spectrum.
Current usage metrics show cumulative count of Article Views (full-text article views including HTML views, PDF and ePub downloads, according to the available data) and Abstracts Views on Vision4Press platform.
Data correspond to usage on the plateform after 2015. The current usage metrics is available 48-96 hours after online publication and is updated daily on week days.
Initial download of the metrics may take a while.