Fig. 2.
Download original image
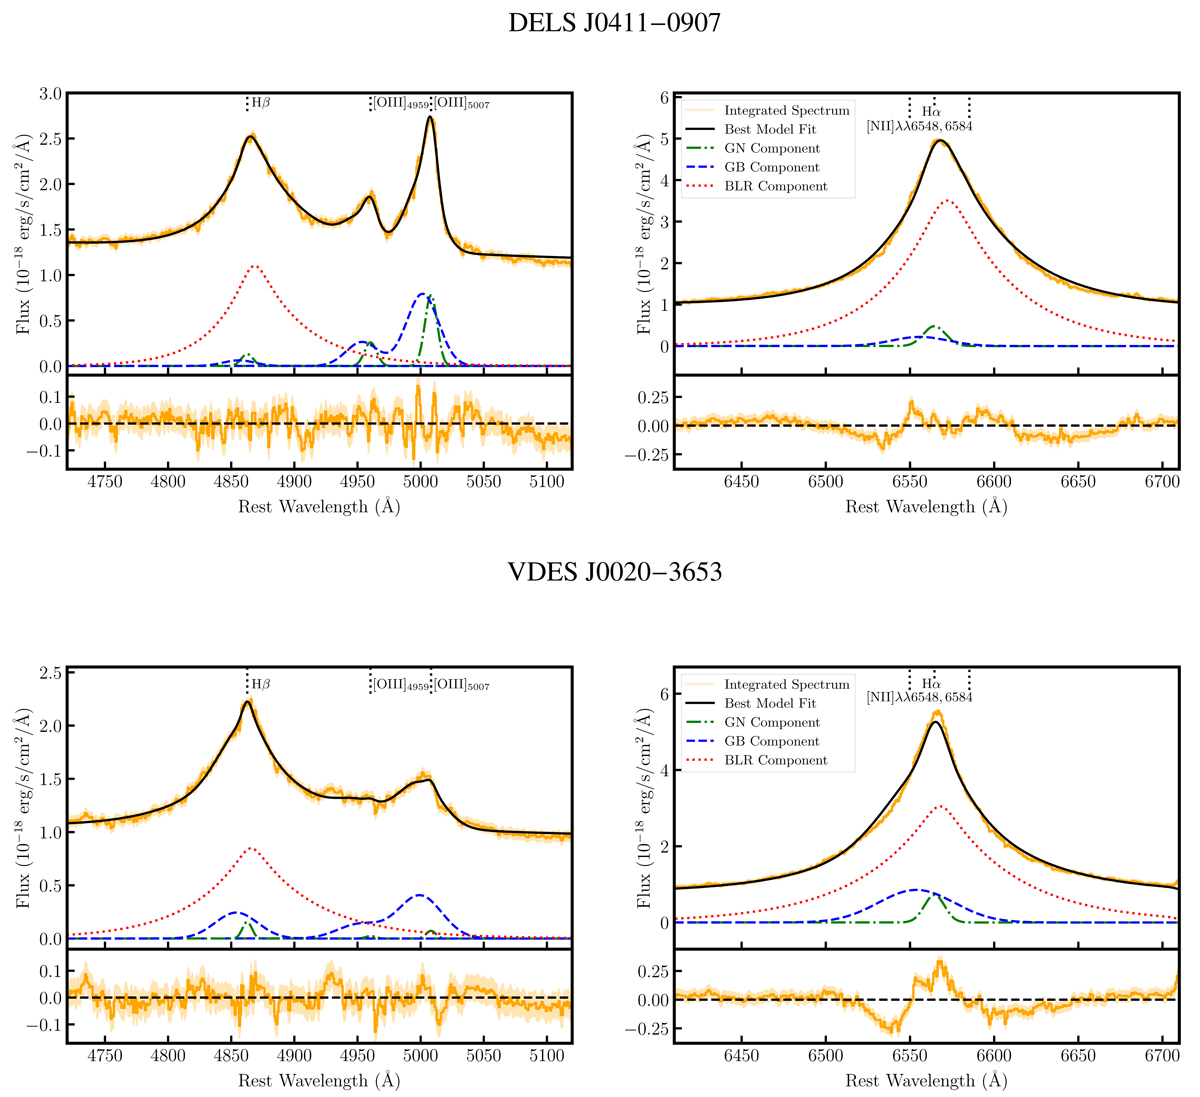
Integrated quasar spectra for DELS J0411–0907 (top) and VDES J0020–3653 (bottom) (orange curve), showing the regions around Hβ (left) and Hα (right). The integrated spectrum was integrated over a radius of 0.35″ for the wavelengths bluewards of the detector gap, and 0.45″ redwards of the gap, corresponding to the apertures selected for our quasar fitting (Sect. 2.3.1). No flux correction has been applied. The best model fit (black) is shown alongside the narrow GN line components (green dot-dashed), the broader GB components (blue dashed lines), and the broken power law component for the BLR (red dotted lines). The lower panels show the residual of the model fit.
Current usage metrics show cumulative count of Article Views (full-text article views including HTML views, PDF and ePub downloads, according to the available data) and Abstracts Views on Vision4Press platform.
Data correspond to usage on the plateform after 2015. The current usage metrics is available 48-96 hours after online publication and is updated daily on week days.
Initial download of the metrics may take a while.