Fig. C.1.
Download original image
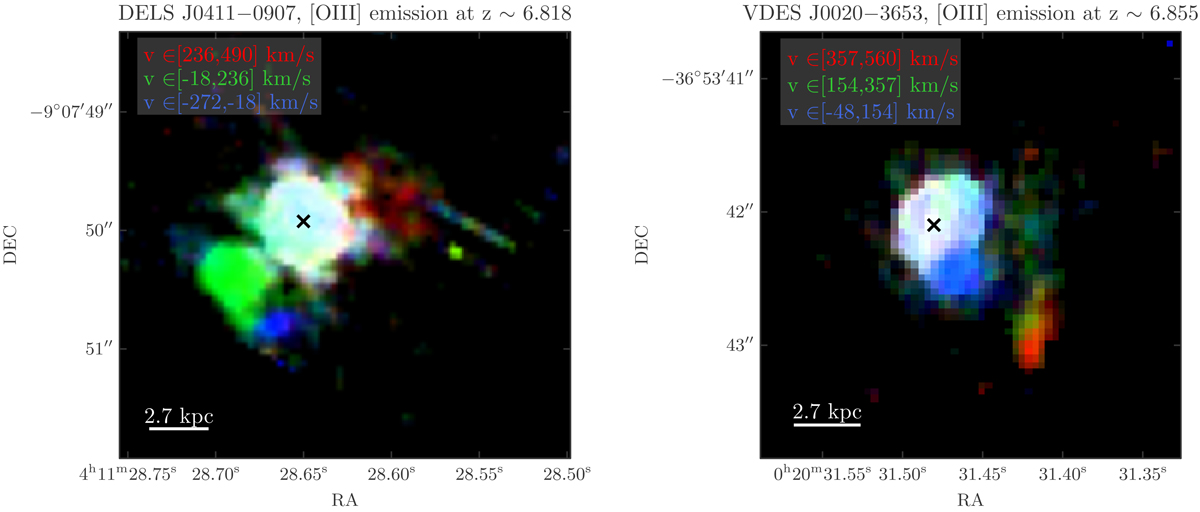
[O III] λ5007 flux maps for DELS J0411–0907 (left) and VDES J0020–3653 (right) using data cubes that have been produced with 0.05″/pix pixels, combined using the drizzle weighting, following the method described in detail in Perna et al. (2023). These maps were made using the original, non-continuum subtracted cubes. The stacked red, green, and blue images depict the integral of the flux across each of the specified wavelength or velocity windows, relative to the quasar redshift. The quasar peak location is marked as a black cross.
Current usage metrics show cumulative count of Article Views (full-text article views including HTML views, PDF and ePub downloads, according to the available data) and Abstracts Views on Vision4Press platform.
Data correspond to usage on the plateform after 2015. The current usage metrics is available 48-96 hours after online publication and is updated daily on week days.
Initial download of the metrics may take a while.