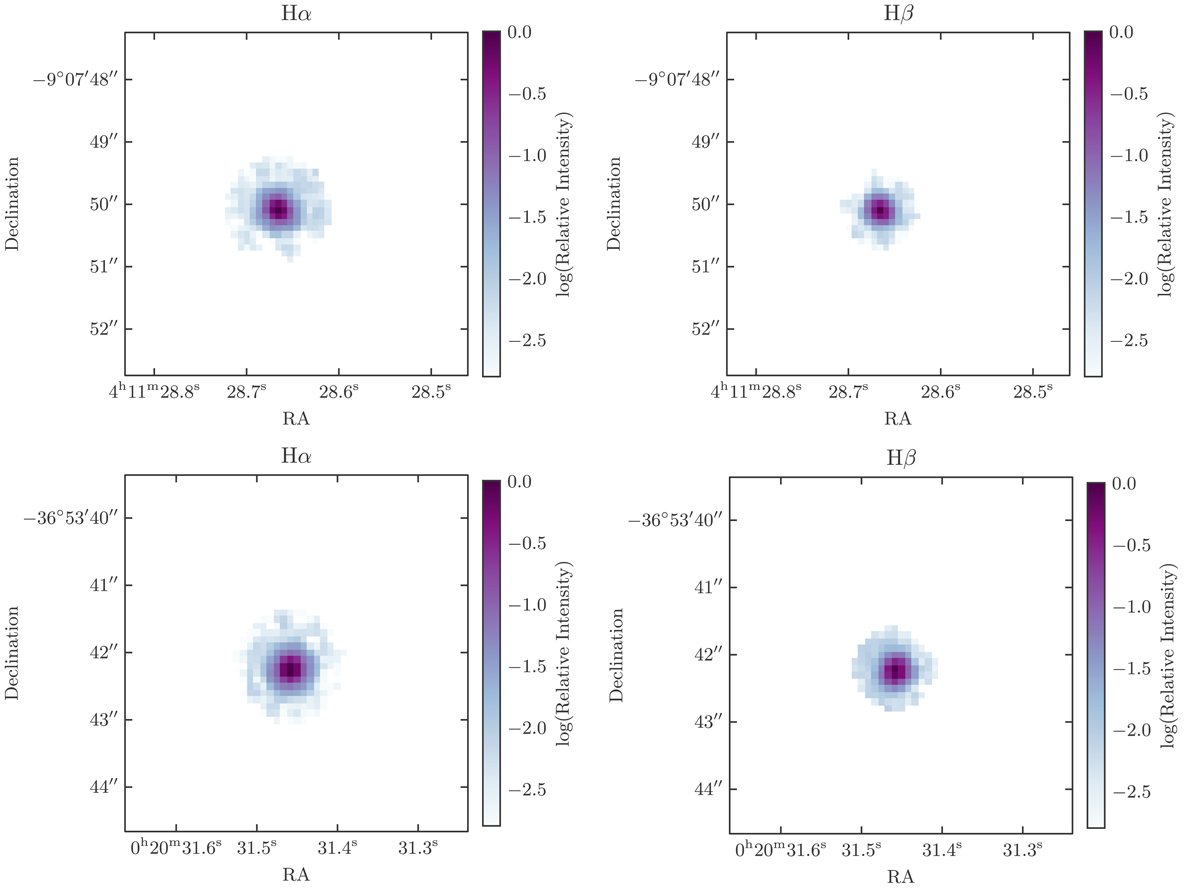
Fig. A.1.
Download original image
PSFs measured from the broad Hα and Hβ lines from DELS J0411–0907 (top) and VDES J0020–3653 (bottom), from the N&B quasar subtraction, as described in Section 2.3.3. These were created from the best fit quasar cube, which is the peak quasar spectrum scaled in flux to match the observed broad line flux in each spaxel. The relative intensity here depicts this scaling factor, which is the amount of flux in each spaxel relative to the brightest spaxel. We created two PSFs for each quasar, one from each of Hα and Hβ, as the PSF varies with wavelength.
Current usage metrics show cumulative count of Article Views (full-text article views including HTML views, PDF and ePub downloads, according to the available data) and Abstracts Views on Vision4Press platform.
Data correspond to usage on the plateform after 2015. The current usage metrics is available 48-96 hours after online publication and is updated daily on week days.
Initial download of the metrics may take a while.