Fig. 10.
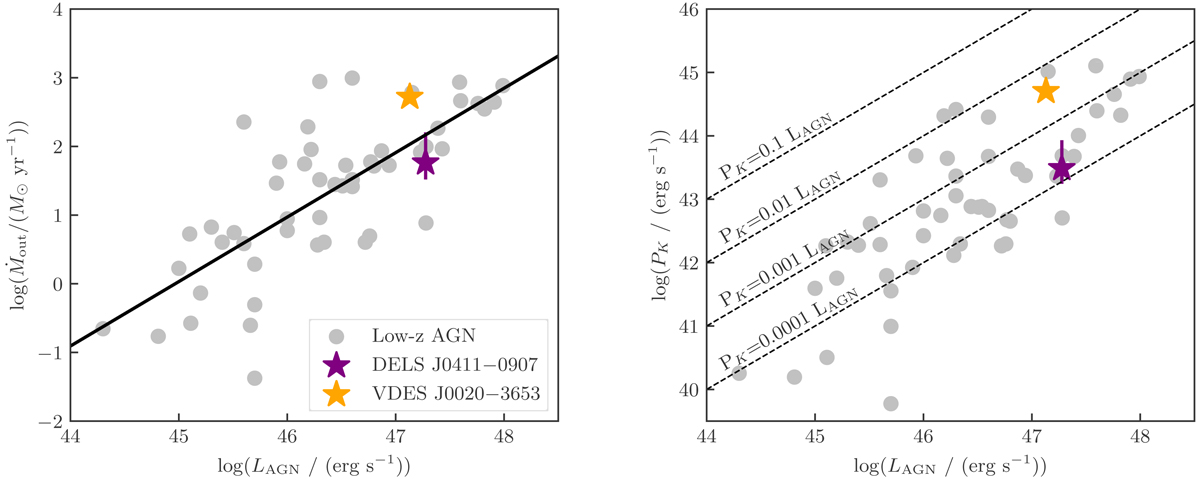
Download original image
Outflows of DELS J0411–0907 and VDES J0020–3653. Left: ionised gas outflow mass rate as a function of AGN luminosity, for the two quasars at z ∼ 6.8 presented in this paper, and for various other AGN at lower redshift (0 < z < 3; from Fiore et al. 2017). The solid line is a linear fit (in logarithmic scales) of the latter data. The ionised outflows of the two quasars at z ∼ 7 follow the same relation as quasars at lower redshifts. Right: kinetic power (PK) of the ionised outflows as a function of AGN luminosity (same symbols as in the left plot). The dashed lines show constant ratios of PK and LAGN as labelled. We note that the Fiore et al. (2017) galaxies have been shifted by log(5/2) for consistency with our density assumption of 500 cm−3, as they assume 200 cm−3.
Current usage metrics show cumulative count of Article Views (full-text article views including HTML views, PDF and ePub downloads, according to the available data) and Abstracts Views on Vision4Press platform.
Data correspond to usage on the plateform after 2015. The current usage metrics is available 48-96 hours after online publication and is updated daily on week days.
Initial download of the metrics may take a while.