Fig. 1.
Download original image
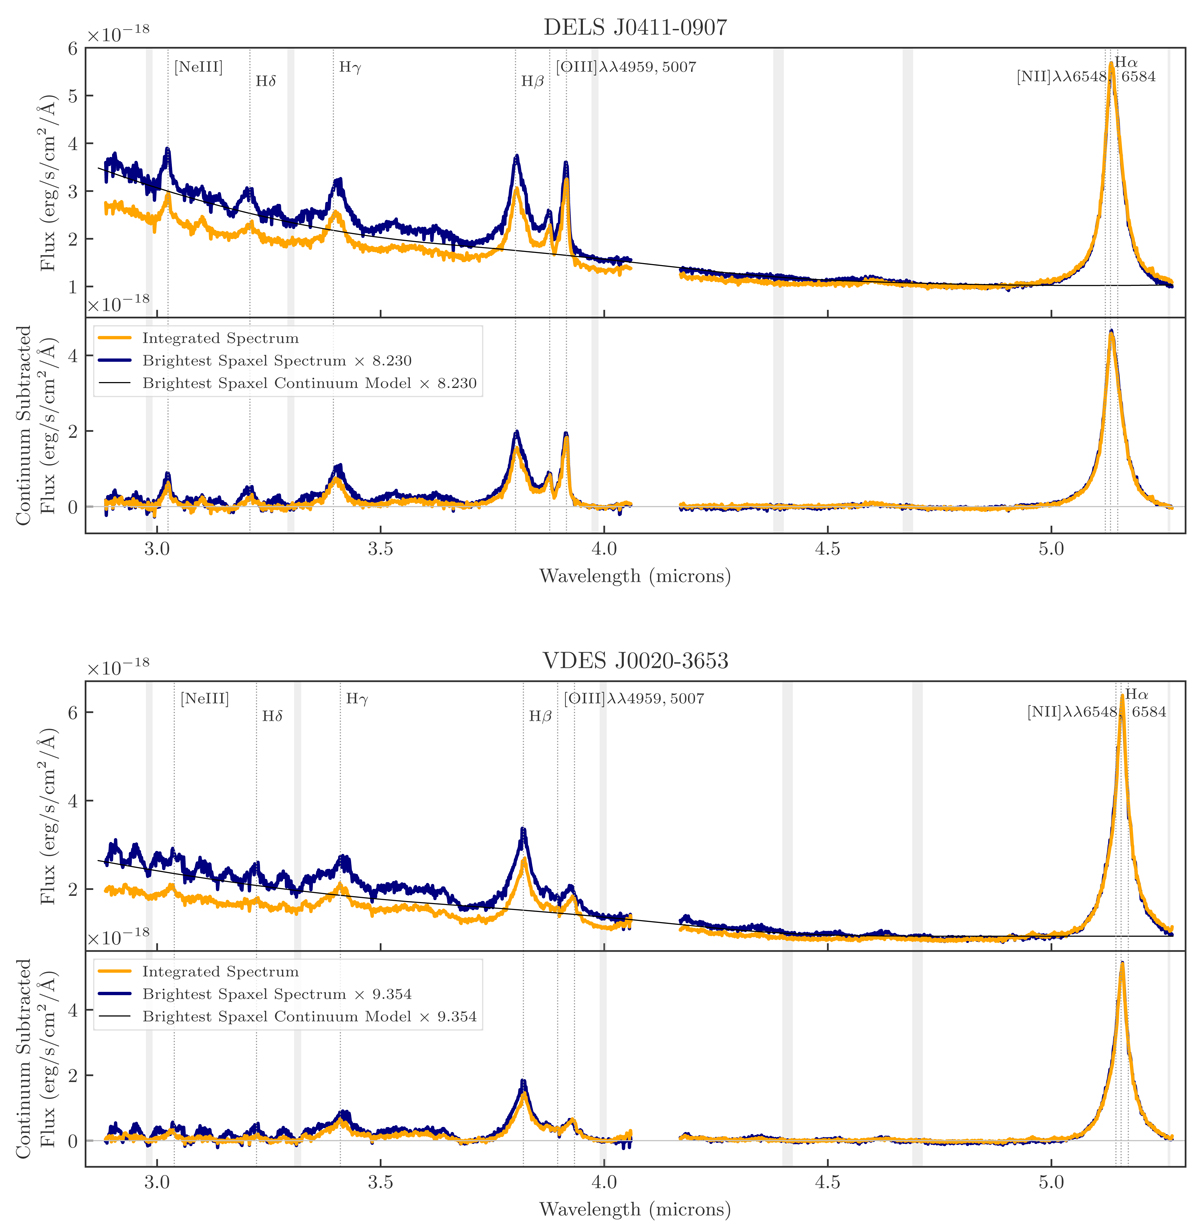
Quasar spectrum for DELS J0411–0907 (top) and VDES J0020–3653 (bottom), showing the spectrum from the brightest spaxel (navy), alongside the integrated spectrum (orange). The integrated spectrum was integrated over a radius of 0.35″ for the wavelengths bluewards of the detector gap, and 0.45″ redwards of the gap, corresponding to the apertures selected for our quasar fitting (Sect. 2.3.1). Our flux corrections of 81.4% and 86.6% have been applied to the integrated spectrum. The spectrum of the brightest spaxel is increased by a constant scaling factor, 8.230 for DELS J0411–0907 and 9.354 for VDES J0020–3653, such that the peak of Hα is equal for both spectra in the plots. The lower panel in each shows the spectra after continuum subtraction. For the brightest spaxel spectrum, the continuum model subtracted from the spectrum is shown in black in the top panel. For the continuum-subtracted integrated spectrum in the lower panel, the integration was performed on the continuum-subtracted cube (i.e. the continuum subtraction was first performed on each of the spaxels individually). The dotted grey vertical lines depict lines of interest at the redshift of the quasar (z = 6.854 for VDES J0020–3653 and z = 6.818 for DELS J0411–0907), and the grey regions show the continuum windows. The detector gap from 4.06 to 4.17 μm has been masked. We note that some minor oscillations are present in the single spaxel spectrum (navy), which can be particularly noticed below 3.3 μm in the single spaxel spectrum. These are caused by spatial undersampling of the PSF, which is a known issue when considering spectra in individual NIRSpec IFU spaxels; we describe this in detail in Perna et al. (2023). When measuring the quasar properties in Sect. 3.1, we used the integrated spectrum (orange), thus removing these single pixel effects. For the quasar subtraction, we found the best performance using the single spaxel spectrum (navy), however these oscillations do not significantly affect our results which directly focus on the regions around Hα and Hβ.
Current usage metrics show cumulative count of Article Views (full-text article views including HTML views, PDF and ePub downloads, according to the available data) and Abstracts Views on Vision4Press platform.
Data correspond to usage on the plateform after 2015. The current usage metrics is available 48-96 hours after online publication and is updated daily on week days.
Initial download of the metrics may take a while.