Open Access
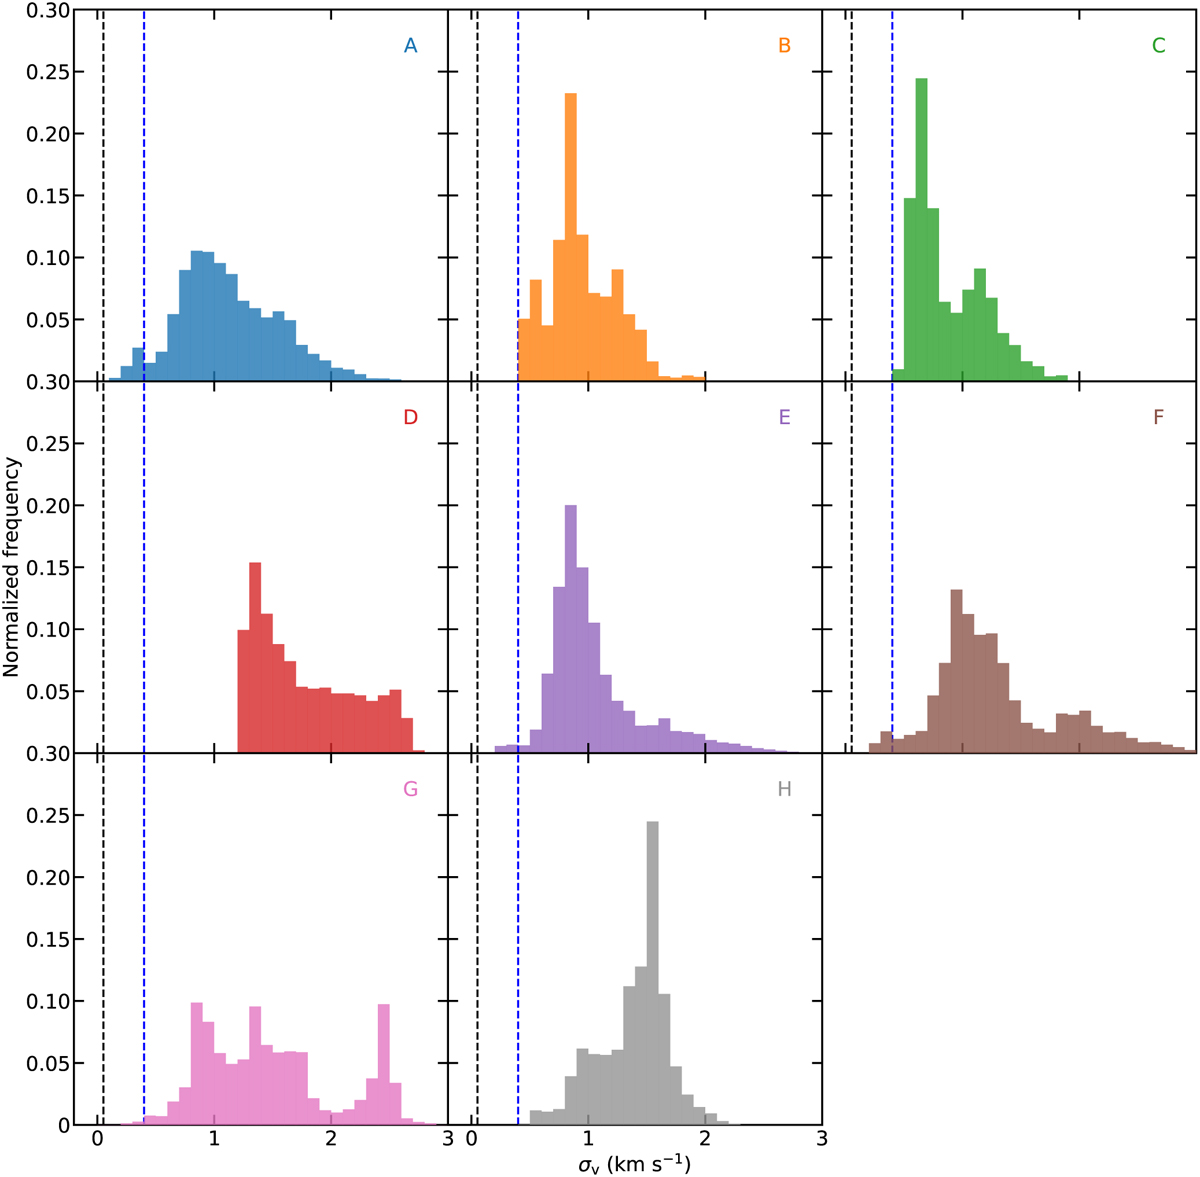
Fig. 9
Download original image
Histogram of observed velocity dispersions of the eight cloud structures derived from the Effelsberg H2CO data. The vertical dashed black and blue lines represent the thermal velocity dispersion of H2CO and twice the sonic speed of 0.19 km s−1 at a kinetic temperature of 10 K, respectively.
Current usage metrics show cumulative count of Article Views (full-text article views including HTML views, PDF and ePub downloads, according to the available data) and Abstracts Views on Vision4Press platform.
Data correspond to usage on the plateform after 2015. The current usage metrics is available 48-96 hours after online publication and is updated daily on week days.
Initial download of the metrics may take a while.