Fig. 5
Download original image
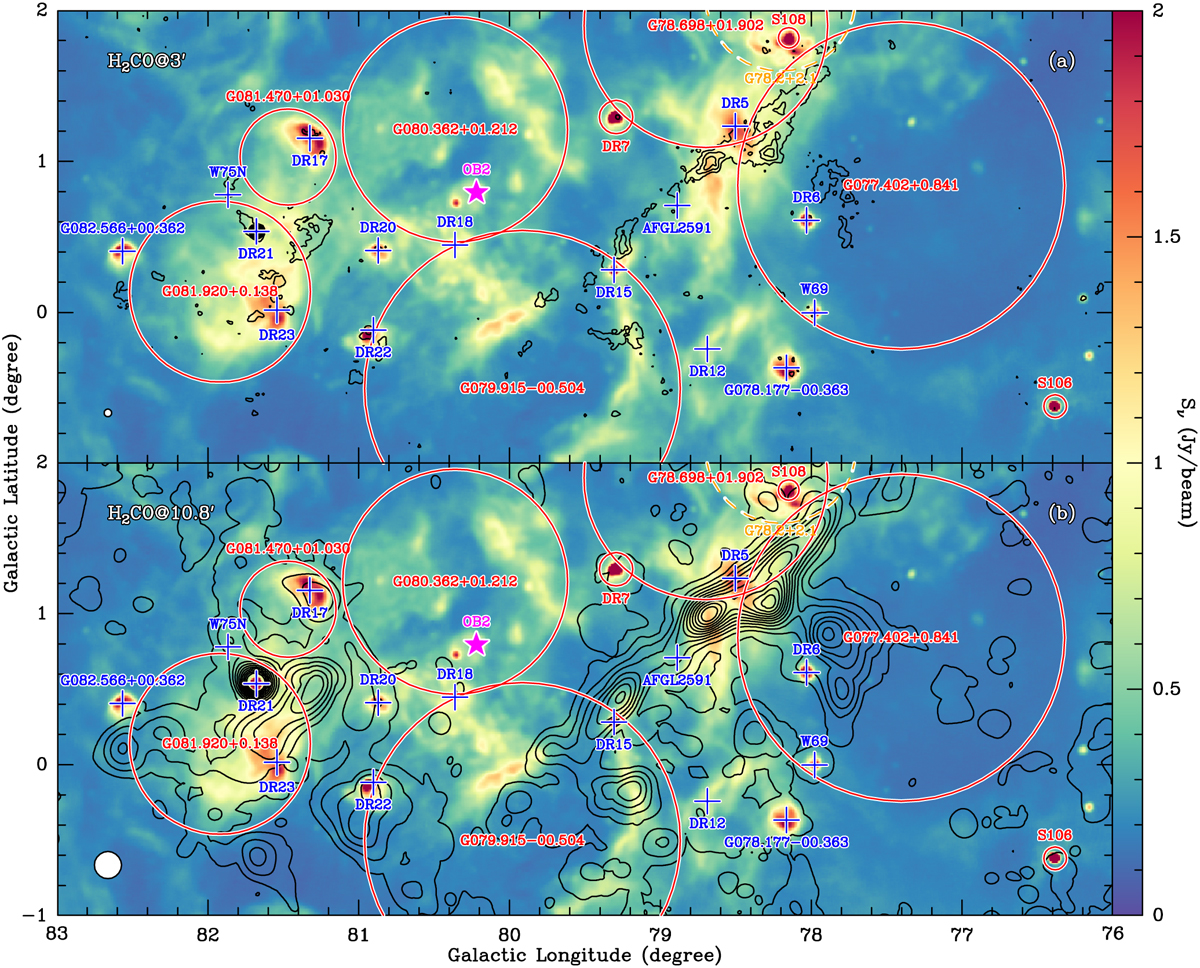
Radio continuum emission and H2CO absorption seen by the Effelsberg 100 m telescope. (a) Effelsberg 4.89 GHz radio continuum emission overlaid with the peak absorption contours of H2CO (11,0–11,1). The corresponding HPBW of H2CO (11,0–11,1) is 3′. The color bar represents the flux densities of the radio continuum emission. The H2CO absorption contours start from −0.5 K (5σ) and decrease by 0.5 K. The developed HII regions from Anderson et al. (2014) are marked with solid red circles, and SNR G78.2+2.1 is indicated by the dashed orange circle. Blue crosses represent the radio continuum sources and active star-forming objects, and the purple star represents the massive star cluster, Cygnus OB2. (b) Similar to Fig. 5a, but the corresponding HPBW of H2CO (11,0–11,1) is 10′.8. The H2CO absorption contours start from −0.08 K (4σ) and decrease by 0.06 K. In both panels, the beam size is shown in the lower left corner.
Current usage metrics show cumulative count of Article Views (full-text article views including HTML views, PDF and ePub downloads, according to the available data) and Abstracts Views on Vision4Press platform.
Data correspond to usage on the plateform after 2015. The current usage metrics is available 48-96 hours after online publication and is updated daily on week days.
Initial download of the metrics may take a while.