Fig. 3
Download original image
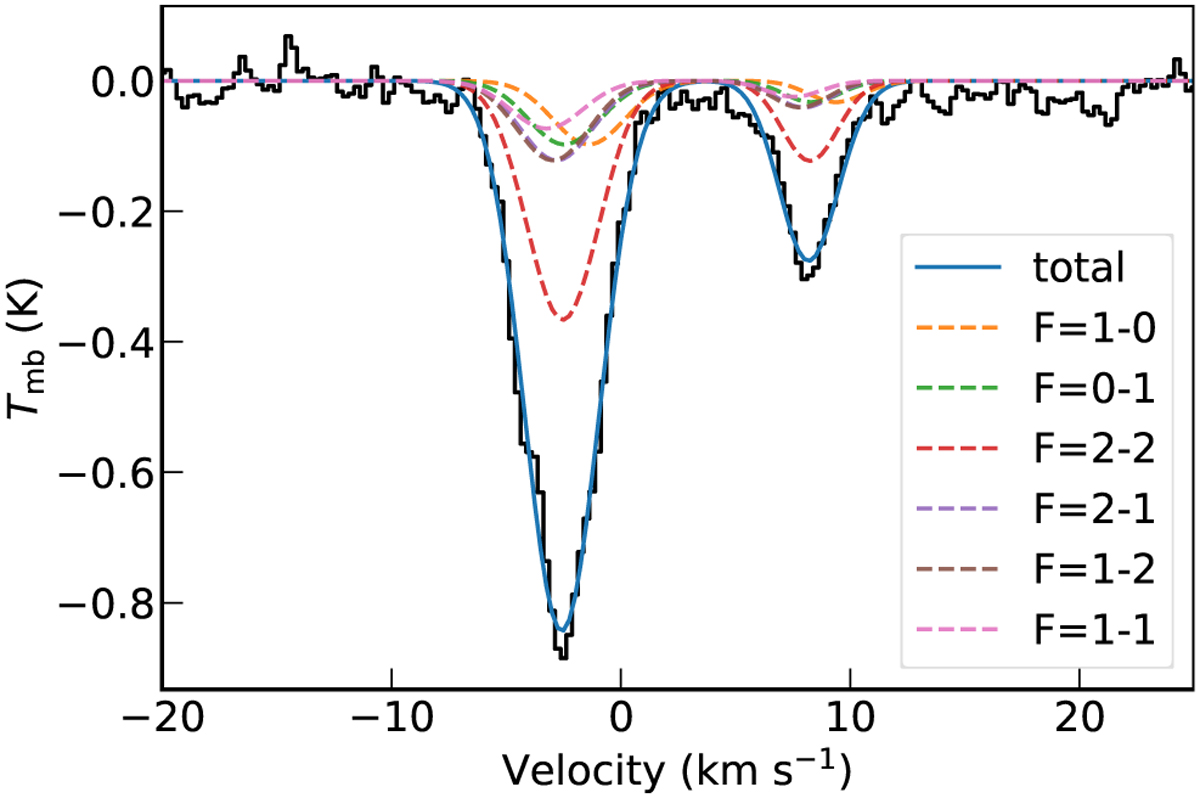
Observed H2CO (11,0–11,1) spectrum at an HPBW of 10′.8 toward DR21 (solid black line) overlaid with the fitted model (solid blue line). The two velocity components at −3 km s−1 and 8 km s−1 correspond to two physically distinct velocity components that arise from the DR21 cloud and its foreground cloud associated with W75N. The fitted HFS components are indicated by the colored dashed lines in the legend.
Current usage metrics show cumulative count of Article Views (full-text article views including HTML views, PDF and ePub downloads, according to the available data) and Abstracts Views on Vision4Press platform.
Data correspond to usage on the plateform after 2015. The current usage metrics is available 48-96 hours after online publication and is updated daily on week days.
Initial download of the metrics may take a while.