Open Access
Fig. B.1
Download original image
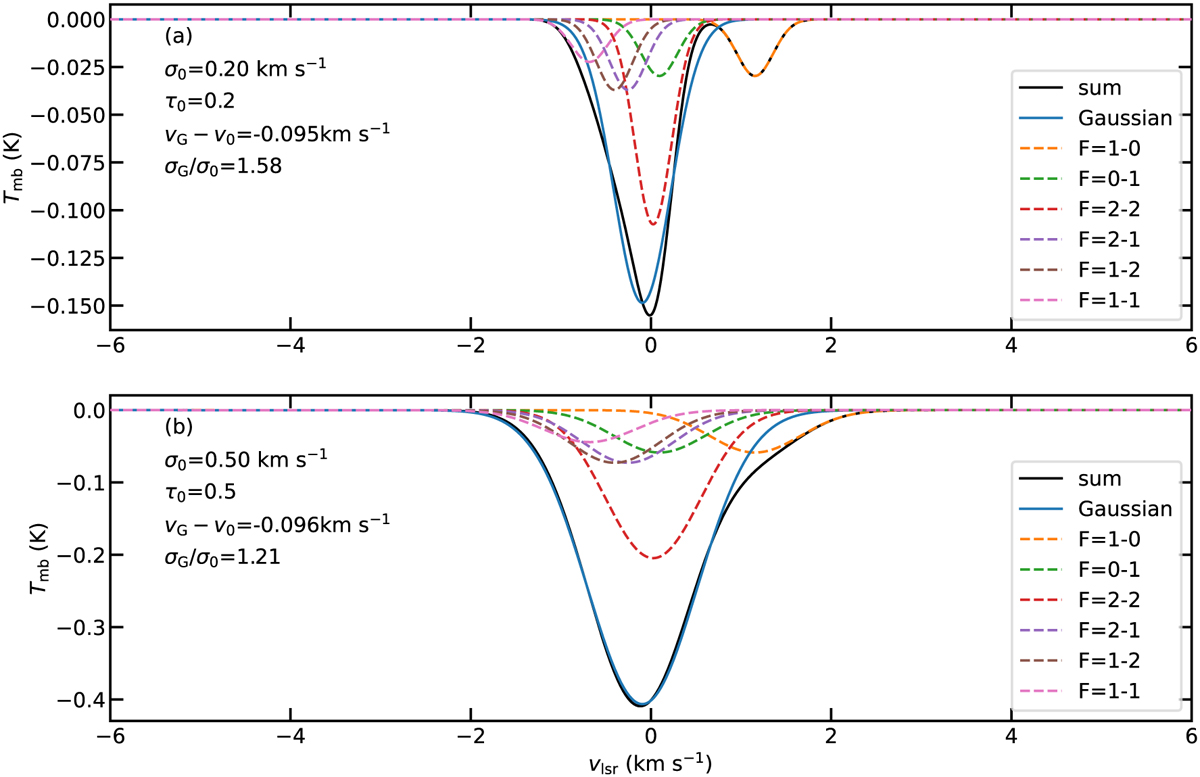
Synthetic H2CO (11,0−11,1) spectra (solid black lines) with the modeled τ0 and συ shown in the upper left corners. The Gaussian fitting results are indicated by the solid blue lines. The different HFS components are indicated by the colored dashed lines in the legend.
Current usage metrics show cumulative count of Article Views (full-text article views including HTML views, PDF and ePub downloads, according to the available data) and Abstracts Views on Vision4Press platform.
Data correspond to usage on the plateform after 2015. The current usage metrics is available 48-96 hours after online publication and is updated daily on week days.
Initial download of the metrics may take a while.