Fig. 17
Download original image
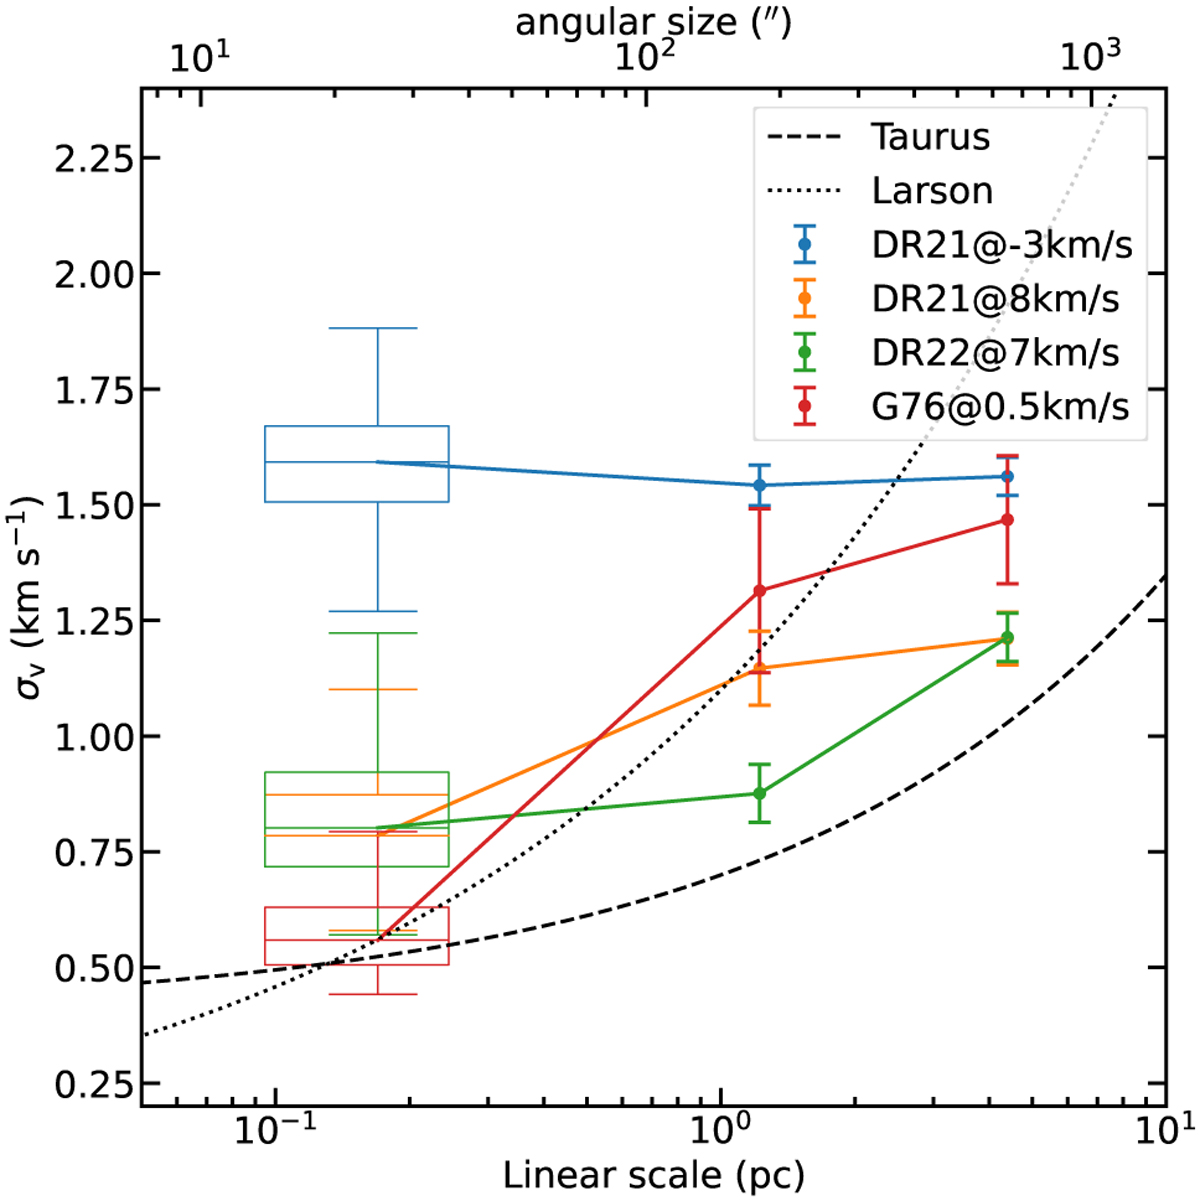
Velocity dispersions of H2CO (11,0−11,1) as a function of different linear scales toward the targeted sources. The classic Larson relation is indicated by the dotted black line (Larson 1981), and the relation between the velocity dispersion and linear scales in the Taurus molecular cloud is shown by the dashed black line (Qian et al. 2012).
Current usage metrics show cumulative count of Article Views (full-text article views including HTML views, PDF and ePub downloads, according to the available data) and Abstracts Views on Vision4Press platform.
Data correspond to usage on the plateform after 2015. The current usage metrics is available 48-96 hours after online publication and is updated daily on week days.
Initial download of the metrics may take a while.