Open Access
Fig. 16
Download original image
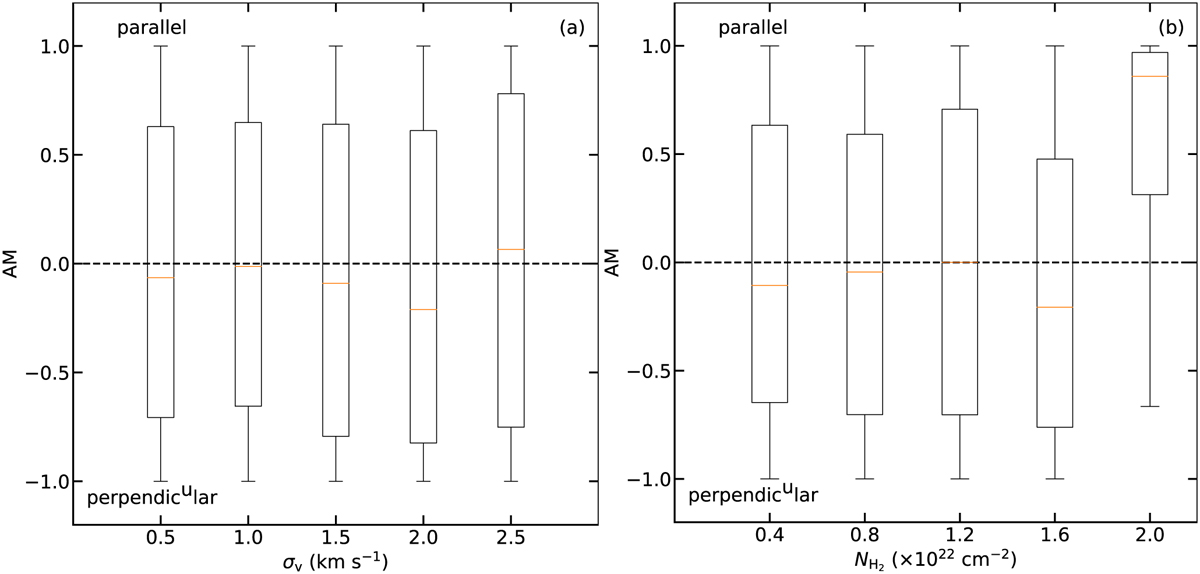
Alignment measure as a function of velocity dispersion (panel a) and H2 column density (panel b). In each box plot, the median value is indicated by an orange line, and the box represents the data within the 25th and 75th percentiles.
Current usage metrics show cumulative count of Article Views (full-text article views including HTML views, PDF and ePub downloads, according to the available data) and Abstracts Views on Vision4Press platform.
Data correspond to usage on the plateform after 2015. The current usage metrics is available 48-96 hours after online publication and is updated daily on week days.
Initial download of the metrics may take a while.