Fig. 15
Download original image
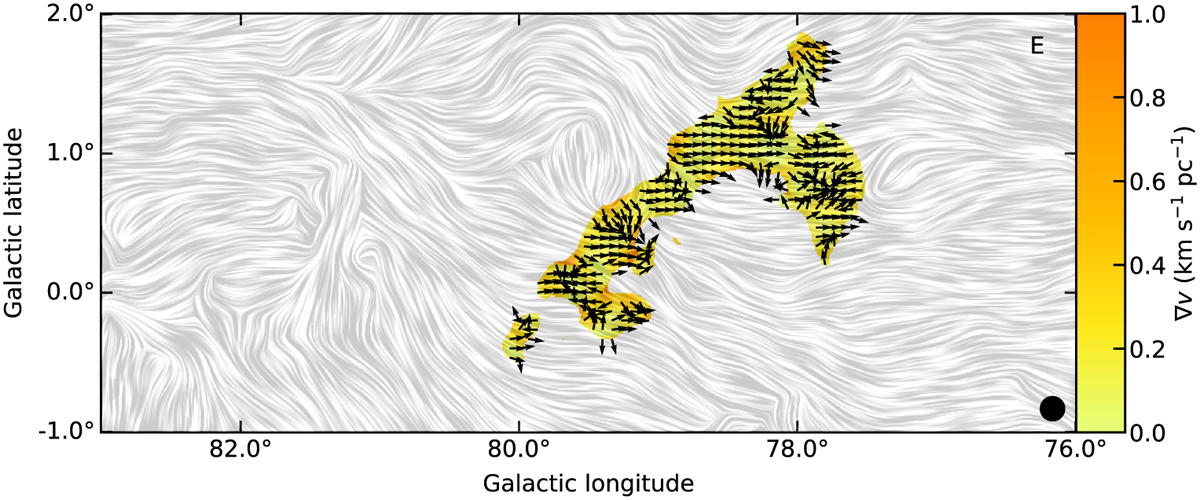
Local velocity gradient map overlaid with the magnetic field pattern derived from the Planck 353 GHz dust polarization. The arrows represent the direction of normalized local velocity gradients, and the color bar represents the magnitude of the local velocity gradients in units of km s−1 pc−1. The beam size is shown in the lower right corner. The coherent structure is labeled in the top right corner.
Current usage metrics show cumulative count of Article Views (full-text article views including HTML views, PDF and ePub downloads, according to the available data) and Abstracts Views on Vision4Press platform.
Data correspond to usage on the plateform after 2015. The current usage metrics is available 48-96 hours after online publication and is updated daily on week days.
Initial download of the metrics may take a while.