Fig. 14
Download original image
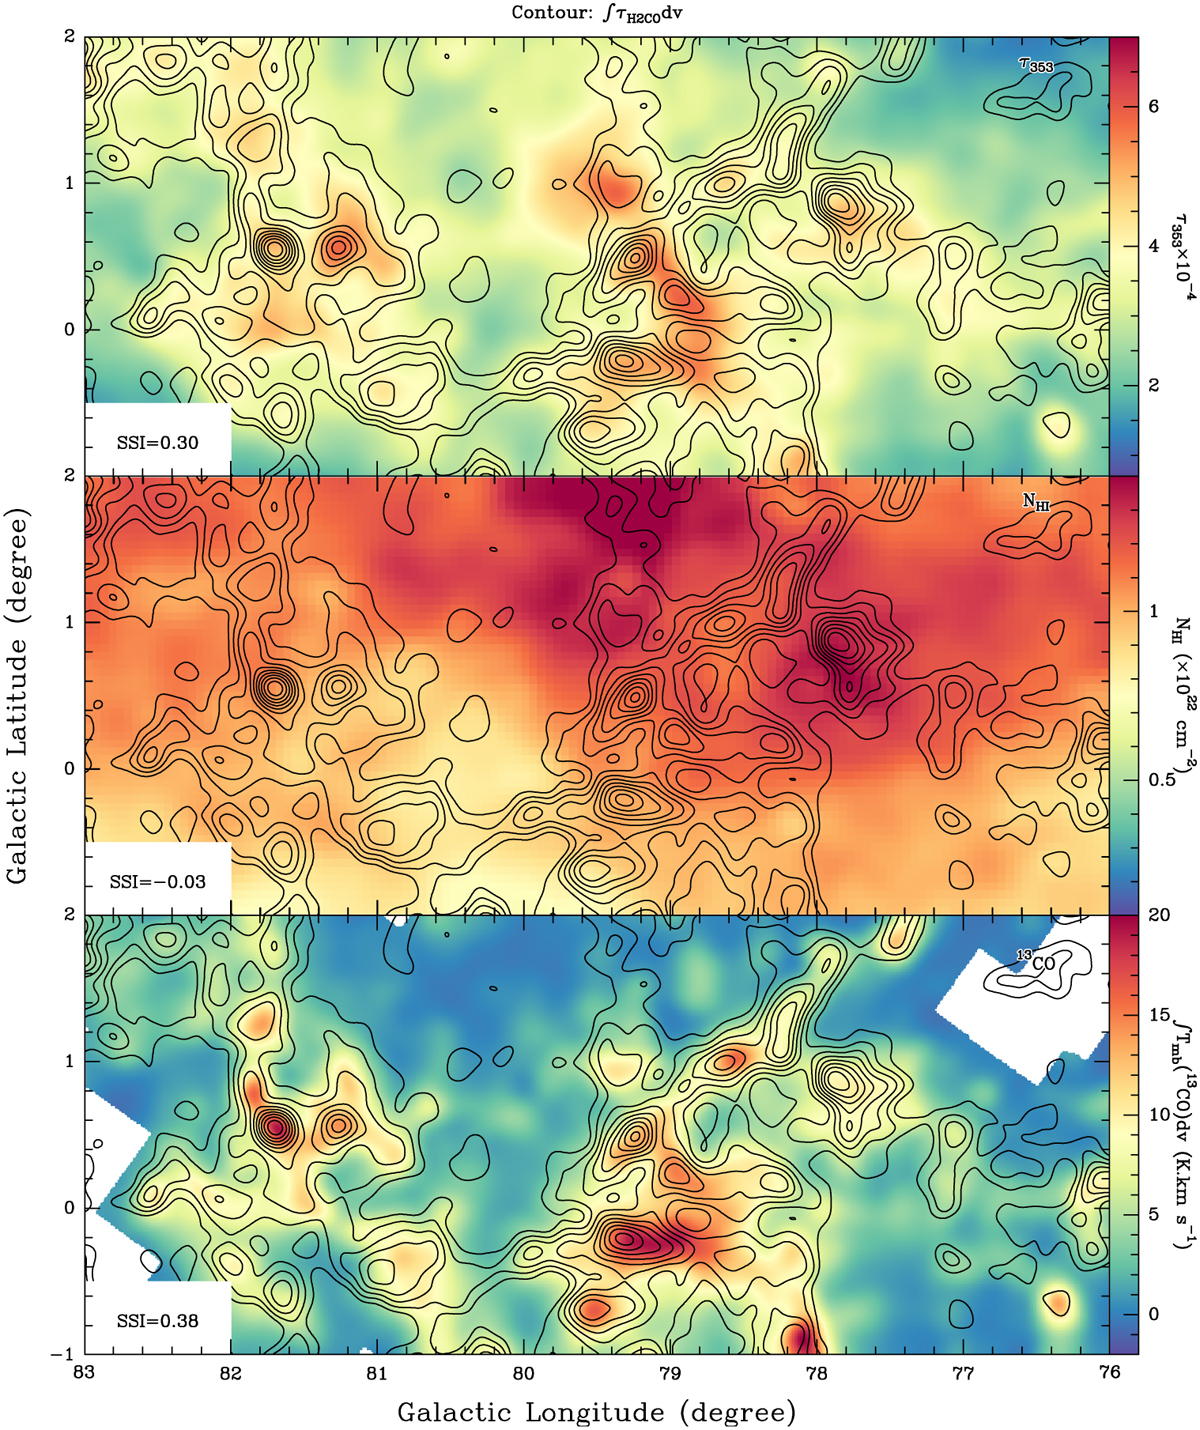
Comparison between the H2CO distribution with that of τ353, NHI, and 13CO. The spatial distribution of τ353 is derived from the Planck measurements (top), the HI column density from EBHIS (Winkel et al. 2016), and the13 CO (1−0) integrated intensity from Schneider et al. (2011) at an angular resolution of 10.8. In all panels, the contours correspond to the smoothed integrated optical depth map of H2CO (11,0−11,1) integrated from −10 km s−1 to 20 km s−1, and they start from 0.09 km s−1 and increase by 0.09 km s−1. The SSI (see Sect. 6.3) of the two corresponding tracers is indicated in the lower left corner of each panel.
Current usage metrics show cumulative count of Article Views (full-text article views including HTML views, PDF and ePub downloads, according to the available data) and Abstracts Views on Vision4Press platform.
Data correspond to usage on the plateform after 2015. The current usage metrics is available 48-96 hours after online publication and is updated daily on week days.
Initial download of the metrics may take a while.