Fig. 12
Download original image
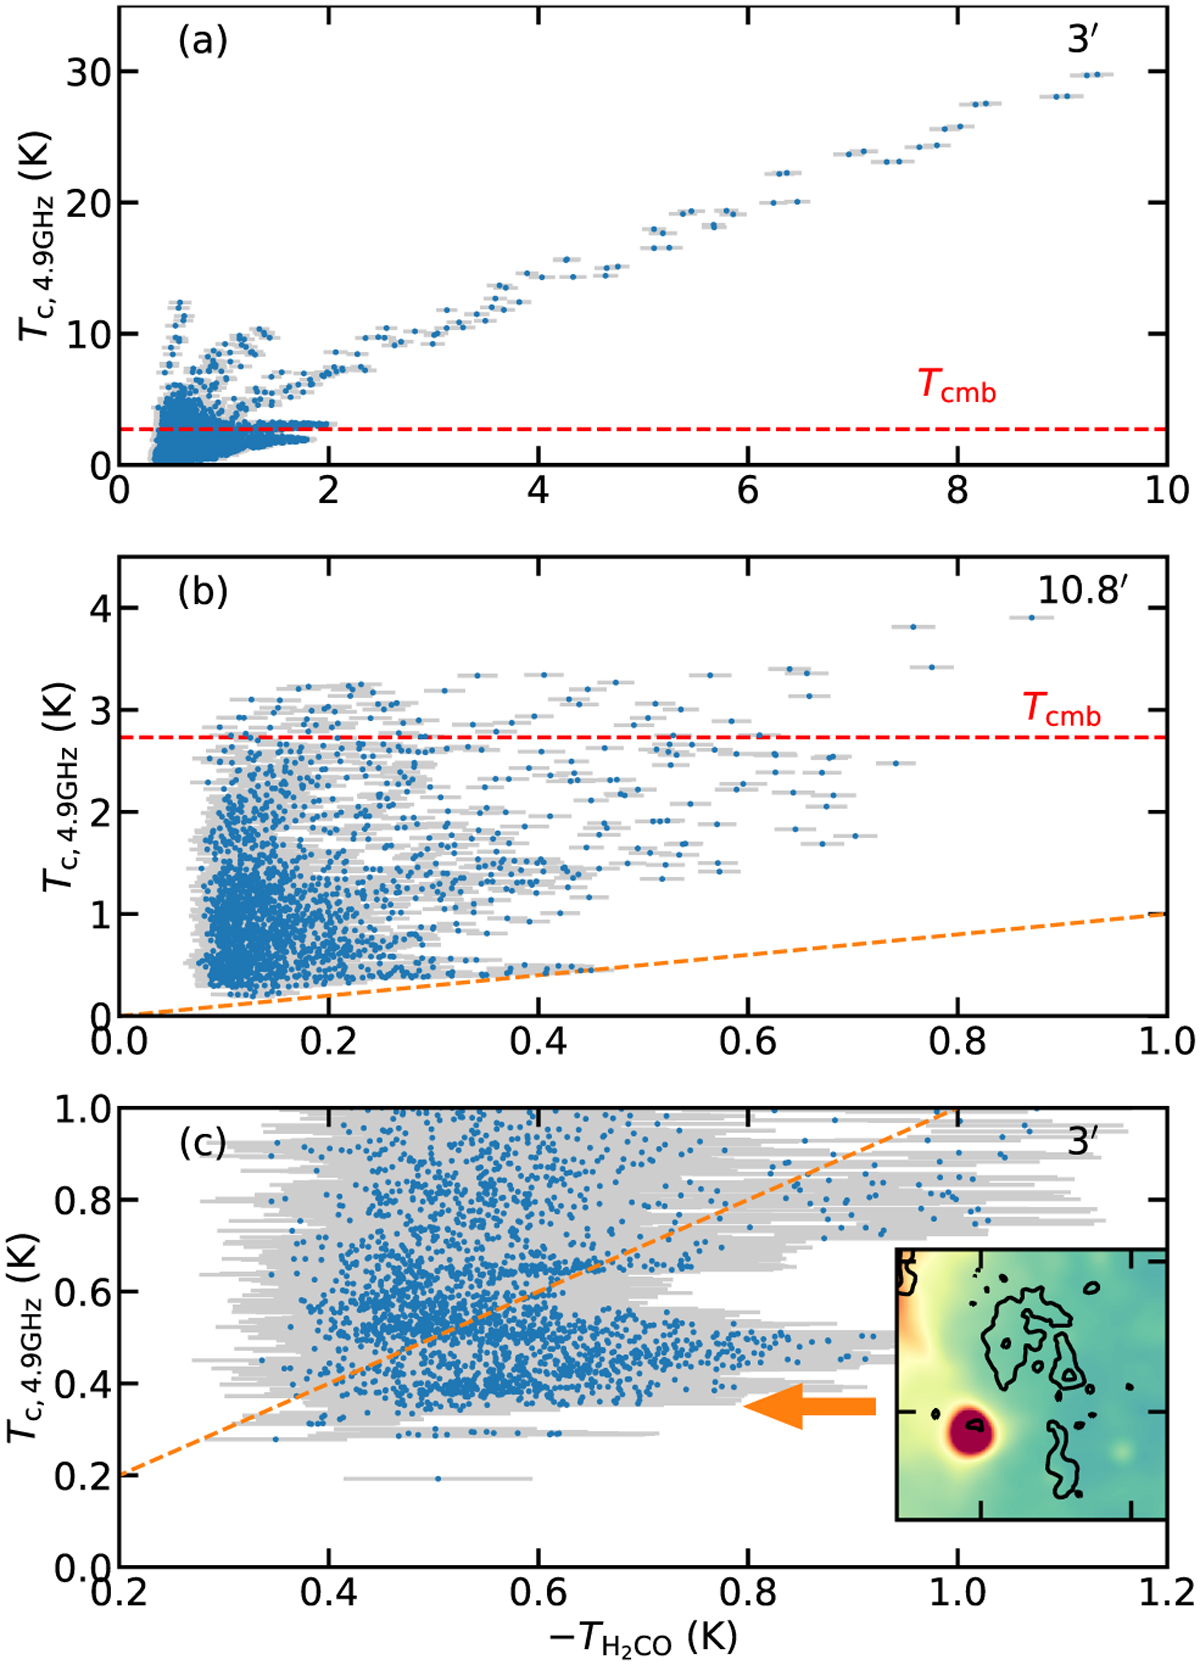
Comparison between the peak intensities of H2CO absorption and the temperatures of the 4.89 GHz radio continuum emission at an angular resolution of 3′ (a) and 10.8 (b). All data points have signal-to-noise ratios of >5. In both panels, the dashed red line represents the CMB temperature of 2.73 K. (c) Same as panel a, but zoomed into a narrower intensity range. The panel in the lower right corner is the same as Fig. 5a, but zoomed into the region where the absorption dip is greater than the radio continuum temperature. In panels b and c, the dashed orange line marks the equality between H2CO peak absorption and radio continuum temperature. In all panels, the error bars represent the 1σ uncertainty.
Current usage metrics show cumulative count of Article Views (full-text article views including HTML views, PDF and ePub downloads, according to the available data) and Abstracts Views on Vision4Press platform.
Data correspond to usage on the plateform after 2015. The current usage metrics is available 48-96 hours after online publication and is updated daily on week days.
Initial download of the metrics may take a while.