Fig. 10
Download original image
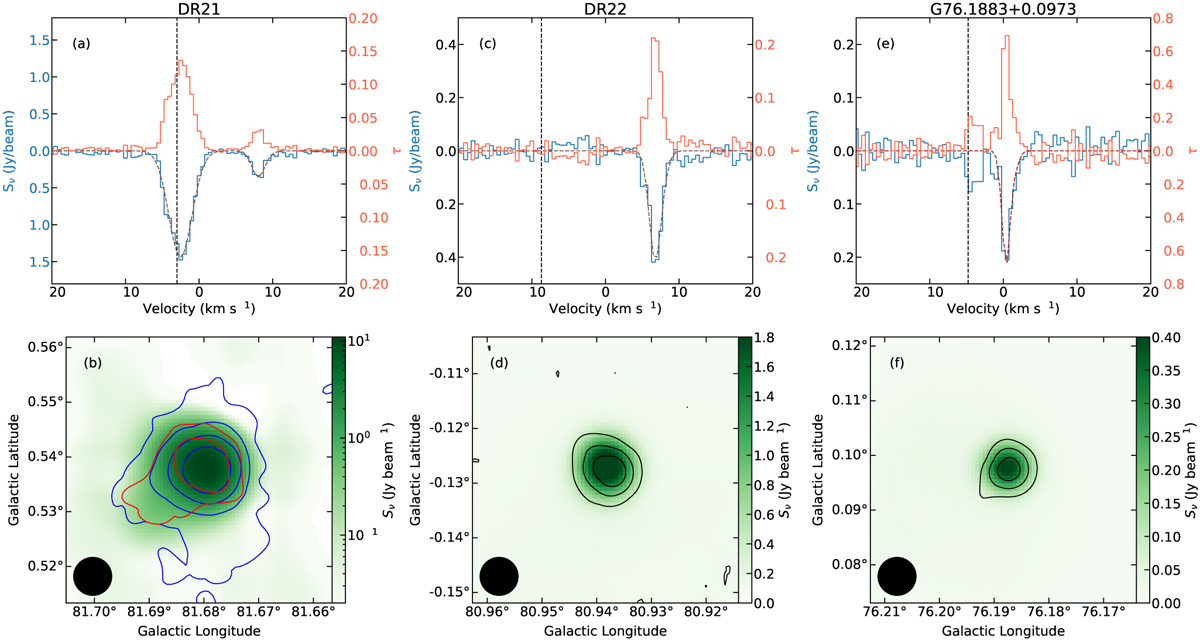
H2CO spectra and their spatial distribution atan angular resolution of 25″. Top: observed H2CO (11,0−11,1) spectra of DR2l (a), DR22 (c), and G76.1883+0.0973 (e) overlaid on the fit results indicated by the dashed brown lines. The derived optical depth spectra are shown by the red lines. In panels a, c, e, the dashed vertical black lines represent the LSR velocities of the HII regions obtained from the radio recombination line measurements (Khan et al. in prep.). Bottom: VLA+Effelsberg 4.9 GHz radio continuum emission of DR2l (b), DR22 (d), and G76.1883+0.0973 (ƒ) overlaid with the H2CO (11,0−11,1) absorption contours. For DR2l, the blue and red contours represent the H2CO (11,0−11,0) absorption peak for the −3 km s−1 and 8 km s−1 components, respectively. The contours start at −0.1 Jy beam−1 (5σ), with each subsequent contour being twice the previous one. For DR22 and G76.1883+0.0973, the contours start at −0.1 Jy beam−1 (5σ) and decrease by 0.04 Jy beam−1. The synthesized beam is shown in the lower left corner of each panel. All the continuum and spectral line data are from the combination of the VLA D configuration and the Effelsberg single-dish observations.
Current usage metrics show cumulative count of Article Views (full-text article views including HTML views, PDF and ePub downloads, according to the available data) and Abstracts Views on Vision4Press platform.
Data correspond to usage on the plateform after 2015. The current usage metrics is available 48-96 hours after online publication and is updated daily on week days.
Initial download of the metrics may take a while.