Fig. 1
Download original image
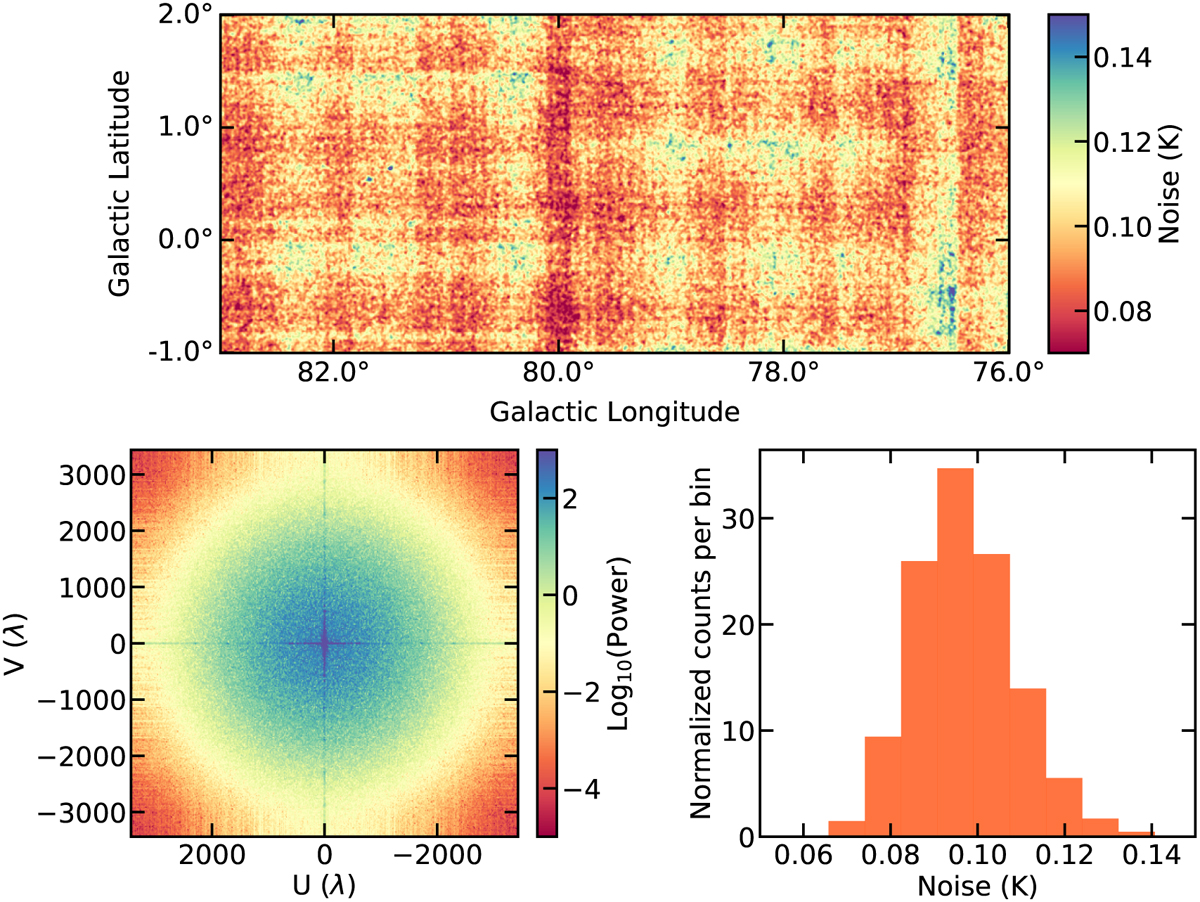
Noise distribution and statistical results. Top: Spatial distribution of the rms noise of the Effelsberg H2CO (11,0–11,1) observations at a channel width of 0.5 km s−1 and an HPBW of 3′. Lower left: Power spectrum of the noise image. The very high power pixels in the cross are artifacts that are caused by the Fourier transform of the sharp image (also known as the Gibbs phenomenon). Lower right: Histogram of the rms noise values. The mean and standard deviation values are 0.10 K and 0.01 K, respectively.
Current usage metrics show cumulative count of Article Views (full-text article views including HTML views, PDF and ePub downloads, according to the available data) and Abstracts Views on Vision4Press platform.
Data correspond to usage on the plateform after 2015. The current usage metrics is available 48-96 hours after online publication and is updated daily on week days.
Initial download of the metrics may take a while.