Fig. 9.
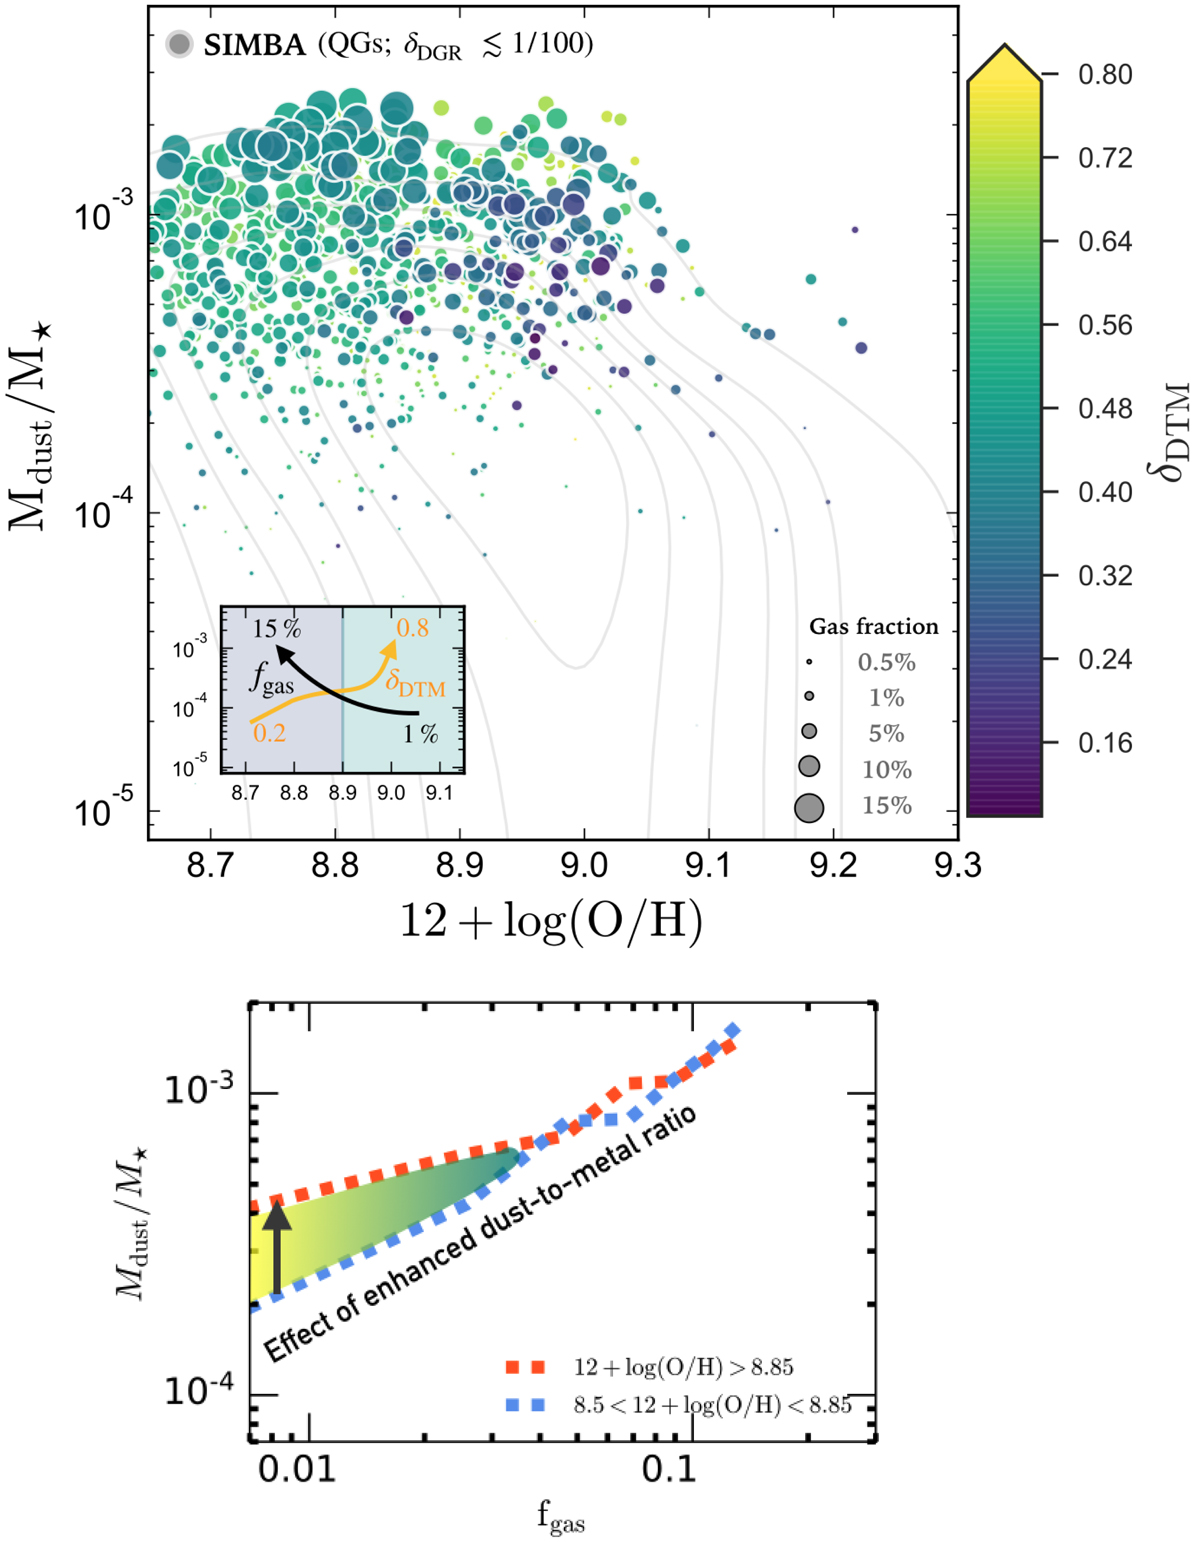
Download original image
Different diagnostics of the evolution of specific dust masses in QGs, as simulated with the SIMBA full-volume simulation run. Upper panel: modelled Mdust/M⋆ as a function of Zgas in SIMBA. Circles represent the modelled QGs within the restricted range of dust-to-gas mass ratios (1/20 < δDGR < 1/100). Grey contours show the distribution of all QGs selected in the simulations with the criteria described in Sect. 6.1. The points are colour-coded by δDTM, with circle sizes scaling to fgas. The inset sketch qualitatively describes the behaviour of Mdust/M⋆: up to a certain Zgas it mostly resembles the change in the molecular gas fraction, while at 12 + log(O/H)≳8.9 it reflects the level of dust growth through the gradual increase in δDTM. Lower panel: evolution of Mdust/M⋆ with fgas for the same simulated sources plotted in the upper panel. The dashed blue and orange lines show median trends for two regimes of Zgas, as indicated in the legend. The effect of an increased dust growth in QGs is most pronounced in sources with heavily exhausted gas reservoirs, as indicated by the lower molecular gas fractions (fgas < 1 − 5%). To highlight this effect through the rise in δDTM, we sketch the shaded area between the two tracks and colour-code it to roughly match the colour bar convention from the upper panel.
Current usage metrics show cumulative count of Article Views (full-text article views including HTML views, PDF and ePub downloads, according to the available data) and Abstracts Views on Vision4Press platform.
Data correspond to usage on the plateform after 2015. The current usage metrics is available 48-96 hours after online publication and is updated daily on week days.
Initial download of the metrics may take a while.