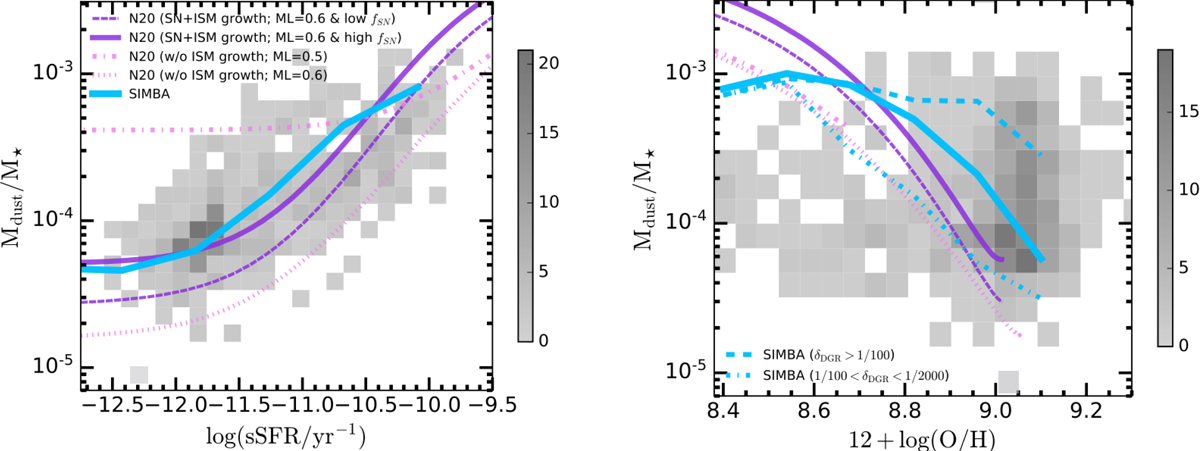
Fig. 8.
Download original image
Evolution of Mdust/M⋆ as a function of sSFR (left) and Zgas (right) modelled with the state-of-the-art cosmological simulation SIMBA (Davé et al. 2019, blue lines) and the chemical evolution model of Nanni et al. (2020, light and dark violet lines). In the panels, darker (lighter) curves related to the N20 model are simulations that include (exclude) dust grain growth in the ISM. These simulation runs include different values of ML factors and grain condensation efficiencies, as indicated in the legend. The solid blue line shows the SIMBA model prediction that is the result of the flagship run (100 Mpc h−1 box), which includes ISM dust growth on metals and all feedback variants. In the right panel, along with the median trend for all selected dusty QGs in SIMBA, we also display average tracks for QGs with different δDGR (dashed blue line for δDGR < 1/100 and dotted-dashed blue line for 1/100 < δDGR < 1/2000). Data from this work (contributing to the ∼90% completeness) are displayed as binned 2D histograms, with the colour bar showing the number of observed QGs in each cell.
Current usage metrics show cumulative count of Article Views (full-text article views including HTML views, PDF and ePub downloads, according to the available data) and Abstracts Views on Vision4Press platform.
Data correspond to usage on the plateform after 2015. The current usage metrics is available 48-96 hours after online publication and is updated daily on week days.
Initial download of the metrics may take a while.