Fig. 7.
Download original image
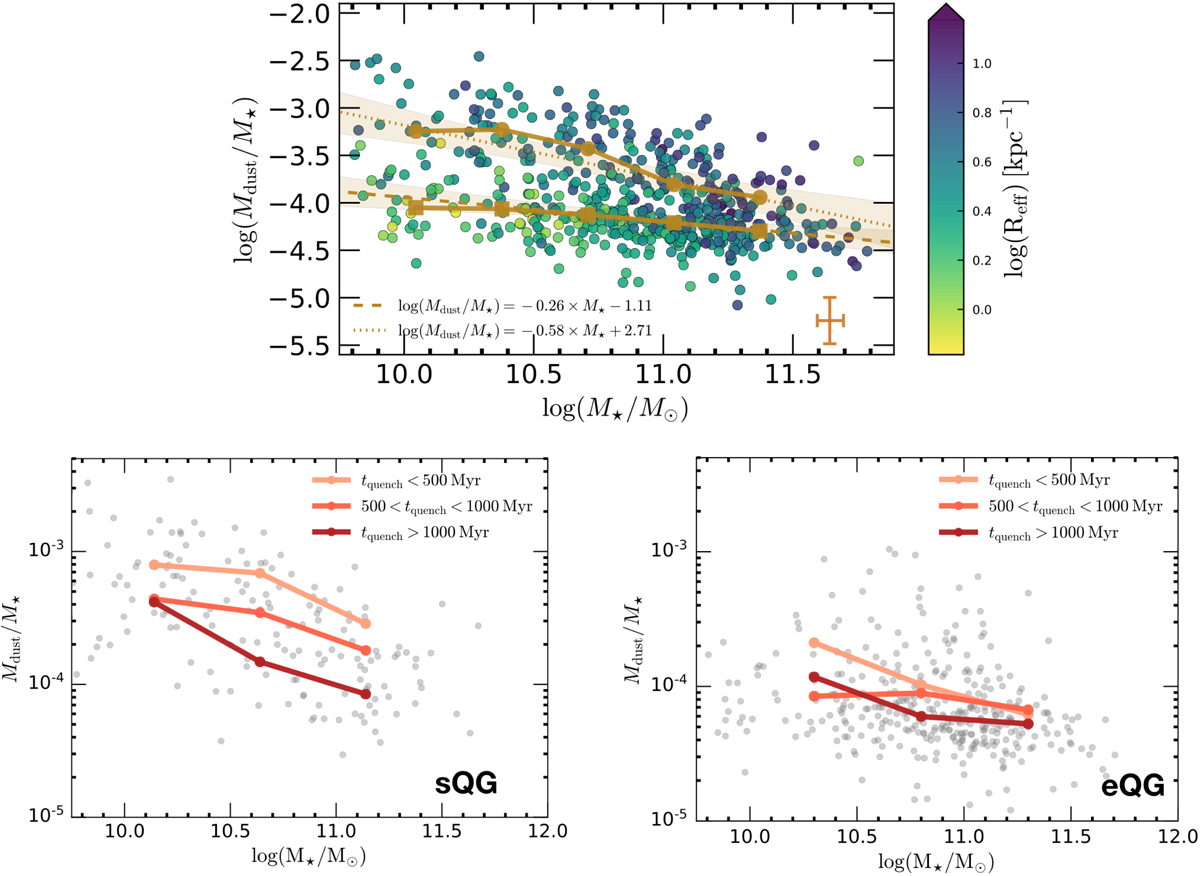
Evolution of Mdust/M⋆ with M⋆ in observed dusty QGs. Upper panel: evolution of Mdust/M⋆ with M⋆, colour-coded as a function of galaxy size (represented with effective radius, Reff, in kpc). Median values in different stellar mass bins are displayed with brown circles and squares for sQGs and eQGs, respectively. The typical errors are shown as brown crosses. The straight lines are the best linear fits that describe the data for sQGs and eQGs. Line symbols and fitting functions are indicated in the legend, and the shaded regions represent 95% confidence intervals of the fit. Lower panel: evolution of Mdust/M⋆ with M⋆ in sQGs (left) and eQGs (right) as a function of time after quenching (tquench). Coloured lines show the evolution of the specific dust mass (as median values in three stellar mass bins) for different post-quenching intervals. The meaning of the coloured lines is indicated in the legend.
Current usage metrics show cumulative count of Article Views (full-text article views including HTML views, PDF and ePub downloads, according to the available data) and Abstracts Views on Vision4Press platform.
Data correspond to usage on the plateform after 2015. The current usage metrics is available 48-96 hours after online publication and is updated daily on week days.
Initial download of the metrics may take a while.