Fig. 5.
Download original image
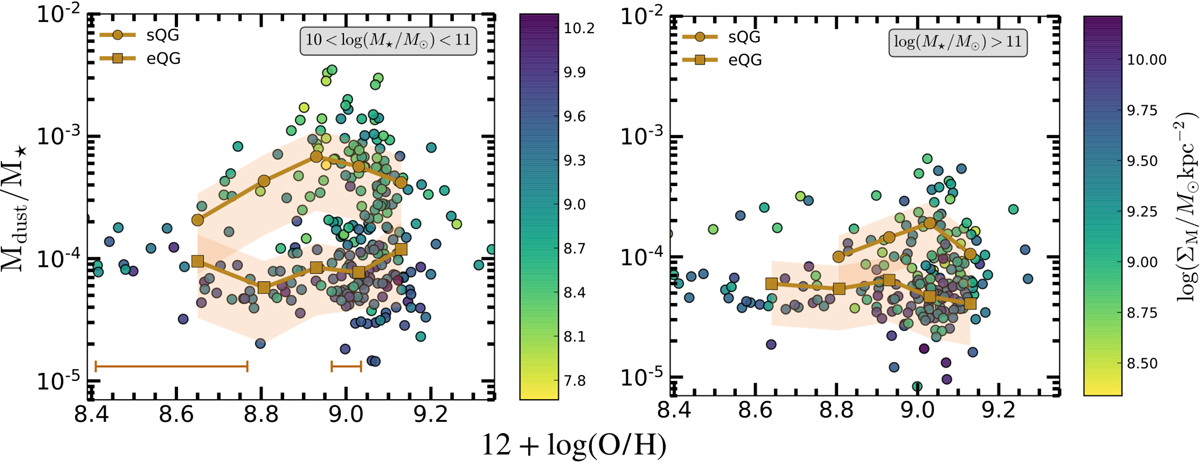
Evolution of Mdust/M⋆ as a function of gas-phase metallicities in QGs from this work. The circles are colour-coded by the stellar mass surface densities (expressed on a logarithmic scale). Galaxies are divided into two mass bins: log(M⋆/M⊙) < 11 (left) and log(M⋆/M⊙) > 11 (right). Brown markers and shaded regions represent the binned medians and 16th–84th percentile range of the resulting distribution for morphologically classified sub-samples of dusty QGs: those classified as eQGs (squares) and sQGs (circles). The typical errors in gas-metallicity estimates for solar and super-solar values are displayed with horizontal lines.
Current usage metrics show cumulative count of Article Views (full-text article views including HTML views, PDF and ePub downloads, according to the available data) and Abstracts Views on Vision4Press platform.
Data correspond to usage on the plateform after 2015. The current usage metrics is available 48-96 hours after online publication and is updated daily on week days.
Initial download of the metrics may take a while.