Fig. 3.
Download original image
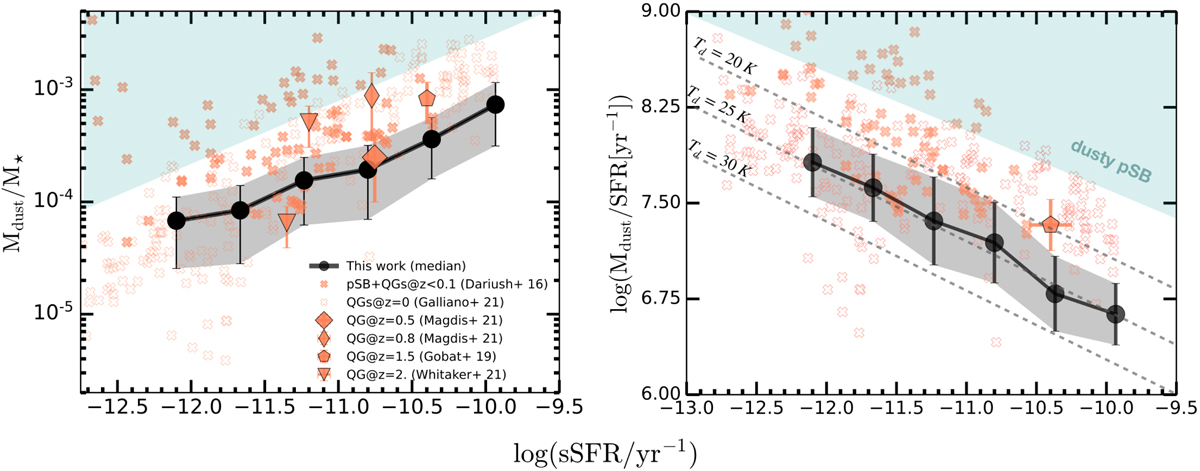
Evolution with sSFR for Mdust/M⋆ (left) and Mdust/SFR (right). Left panel: binned medians and corresponding 16th–84th percentiles of this sample shown as the black circles and the dark grey shaded area, respectively. Open crosses indicate the subsample of quiescent objects drawn from the Dustpedia archive (Galliano et al. 2021). Filled crosses show the compilation of dusty QGs and post-SB galaxies at z < 0.1 detected in H-ATLAS (Dariush et al. 2016). Displayed with salmon-coloured symbols are estimates for the stacked and individual QGs at higher-z’s: stacks are represented with diamonds and pentagons (Gobat et al. 2018; Magdis et al. 2021), while the individual detections are annotated with triangles (Whitaker et al. 2021b). In both panels, the cyan-shaded region illustrates the parameter space where the majority of dusty post-SB galaxies detected with ALMA reside (Li et al. 2019a). Right panel: symbols have the same meaning as in the left panel. Dashed lines roughly track the position of sources within different Tdust, calculated by scaling the strength of the ISRF intensity as derived from CIGALE.
Current usage metrics show cumulative count of Article Views (full-text article views including HTML views, PDF and ePub downloads, according to the available data) and Abstracts Views on Vision4Press platform.
Data correspond to usage on the plateform after 2015. The current usage metrics is available 48-96 hours after online publication and is updated daily on week days.
Initial download of the metrics may take a while.