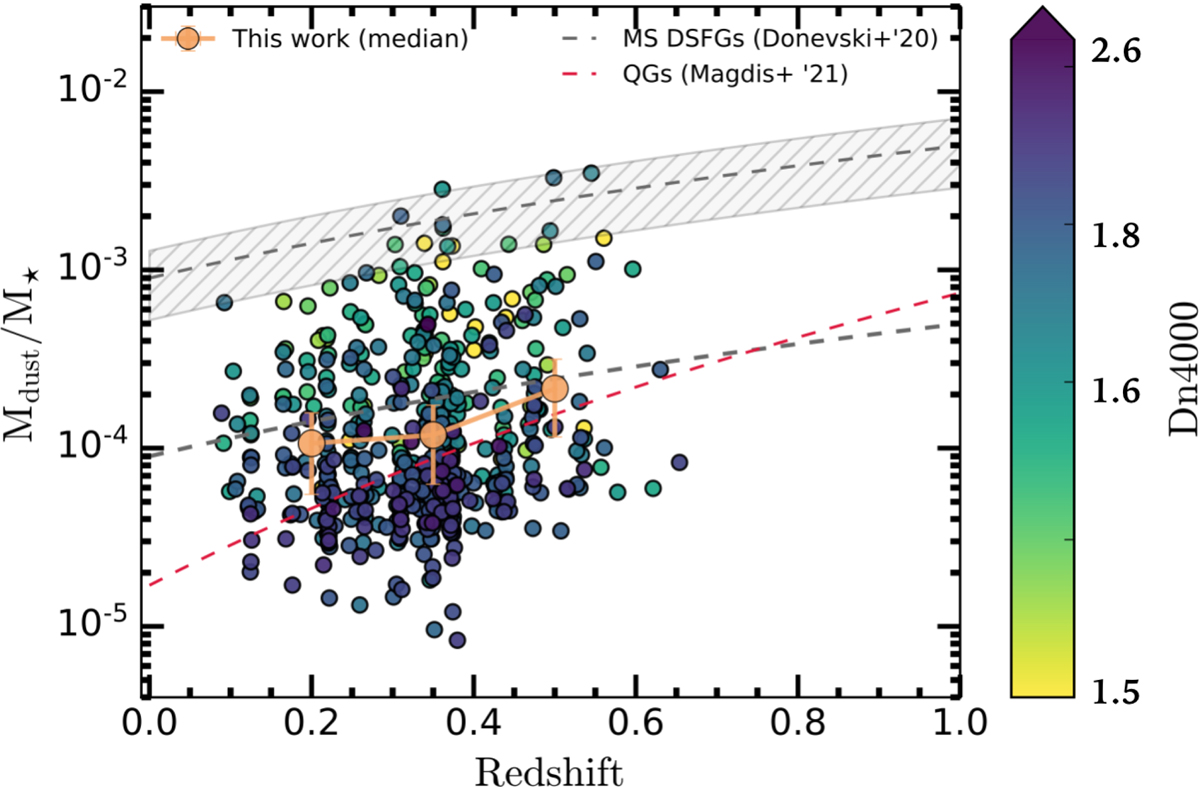
Fig. 2.
Download original image
Observed redshift evolution of Mdust/M⋆ in dusty QGs from this work. Individual values are displayed with circles, coloured according to the corresponding Dn4000. Binned medians and associated uncertainties (16th–84th percentile range) are shown with sandy brown circles and lines, respectively. For comparison, with the dashed red line we show the best fit from the stacking analysis of Magdis et al. (2021). The dark grey line and shaded area describe the modelled evolution of ALMA-detected MS galaxies with a functional form of Mdust/M⋆ ∝ k × (1 + z)2.5 (Donevski et al. 2020), while the dashed dark grey line shows the shift of 1 dex of this MS scaling relation.
Current usage metrics show cumulative count of Article Views (full-text article views including HTML views, PDF and ePub downloads, according to the available data) and Abstracts Views on Vision4Press platform.
Data correspond to usage on the plateform after 2015. The current usage metrics is available 48-96 hours after online publication and is updated daily on week days.
Initial download of the metrics may take a while.