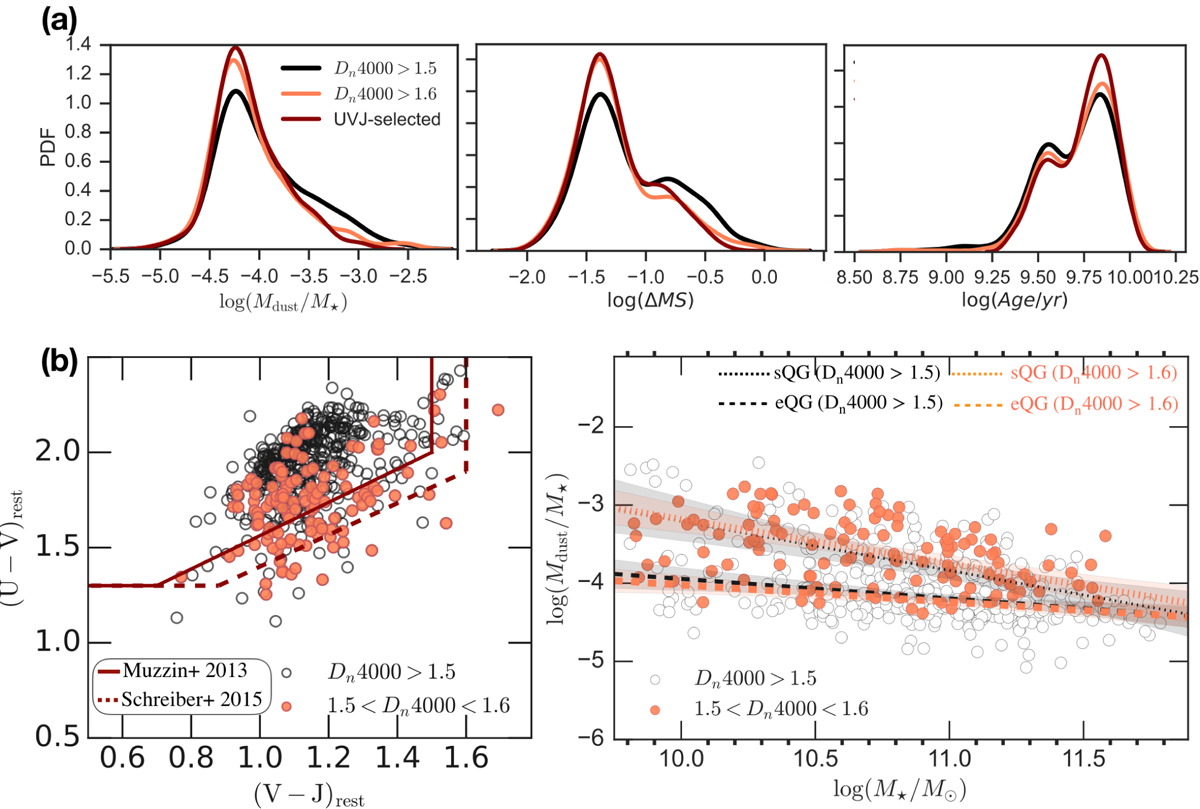
Fig. C.1.
Download original image
Comparisons between the different criteria for selecting QGs. Upper panel: Distributions of Mdust/M⋆, ΔMS and stellar age for our parent sample (solid black line) against the samples satisfying additional criteria of quiescence: UVJ selection proposed in Muzzin et al. (2013) (dark red line) and Dn4000 > 1.6 (orange line). Lower panel (left:) Positions of 545 dusty QGs from this work in the UVJ rest-frame colour plane. Regions defined with solid and dashed lines correspond to the criteria indicated in the legend. Coloured circles represent QGs with 1.5 < Dn4000 < 1.6 and can be considered potential contaminants; (right:) Evolution of specific dust mass as a function of M⋆. The meanings of the symbols are the same as in the left panel. Best linear fits are shown for eQGs and sQGs for two different cases: the main selection that includes 545 QGs (dark grey lines) and the selection that fulfils the stricter spectroscopic criterion Dn4000 > 1.6 (salmon coloured lines).
Current usage metrics show cumulative count of Article Views (full-text article views including HTML views, PDF and ePub downloads, according to the available data) and Abstracts Views on Vision4Press platform.
Data correspond to usage on the plateform after 2015. The current usage metrics is available 48-96 hours after online publication and is updated daily on week days.
Initial download of the metrics may take a while.