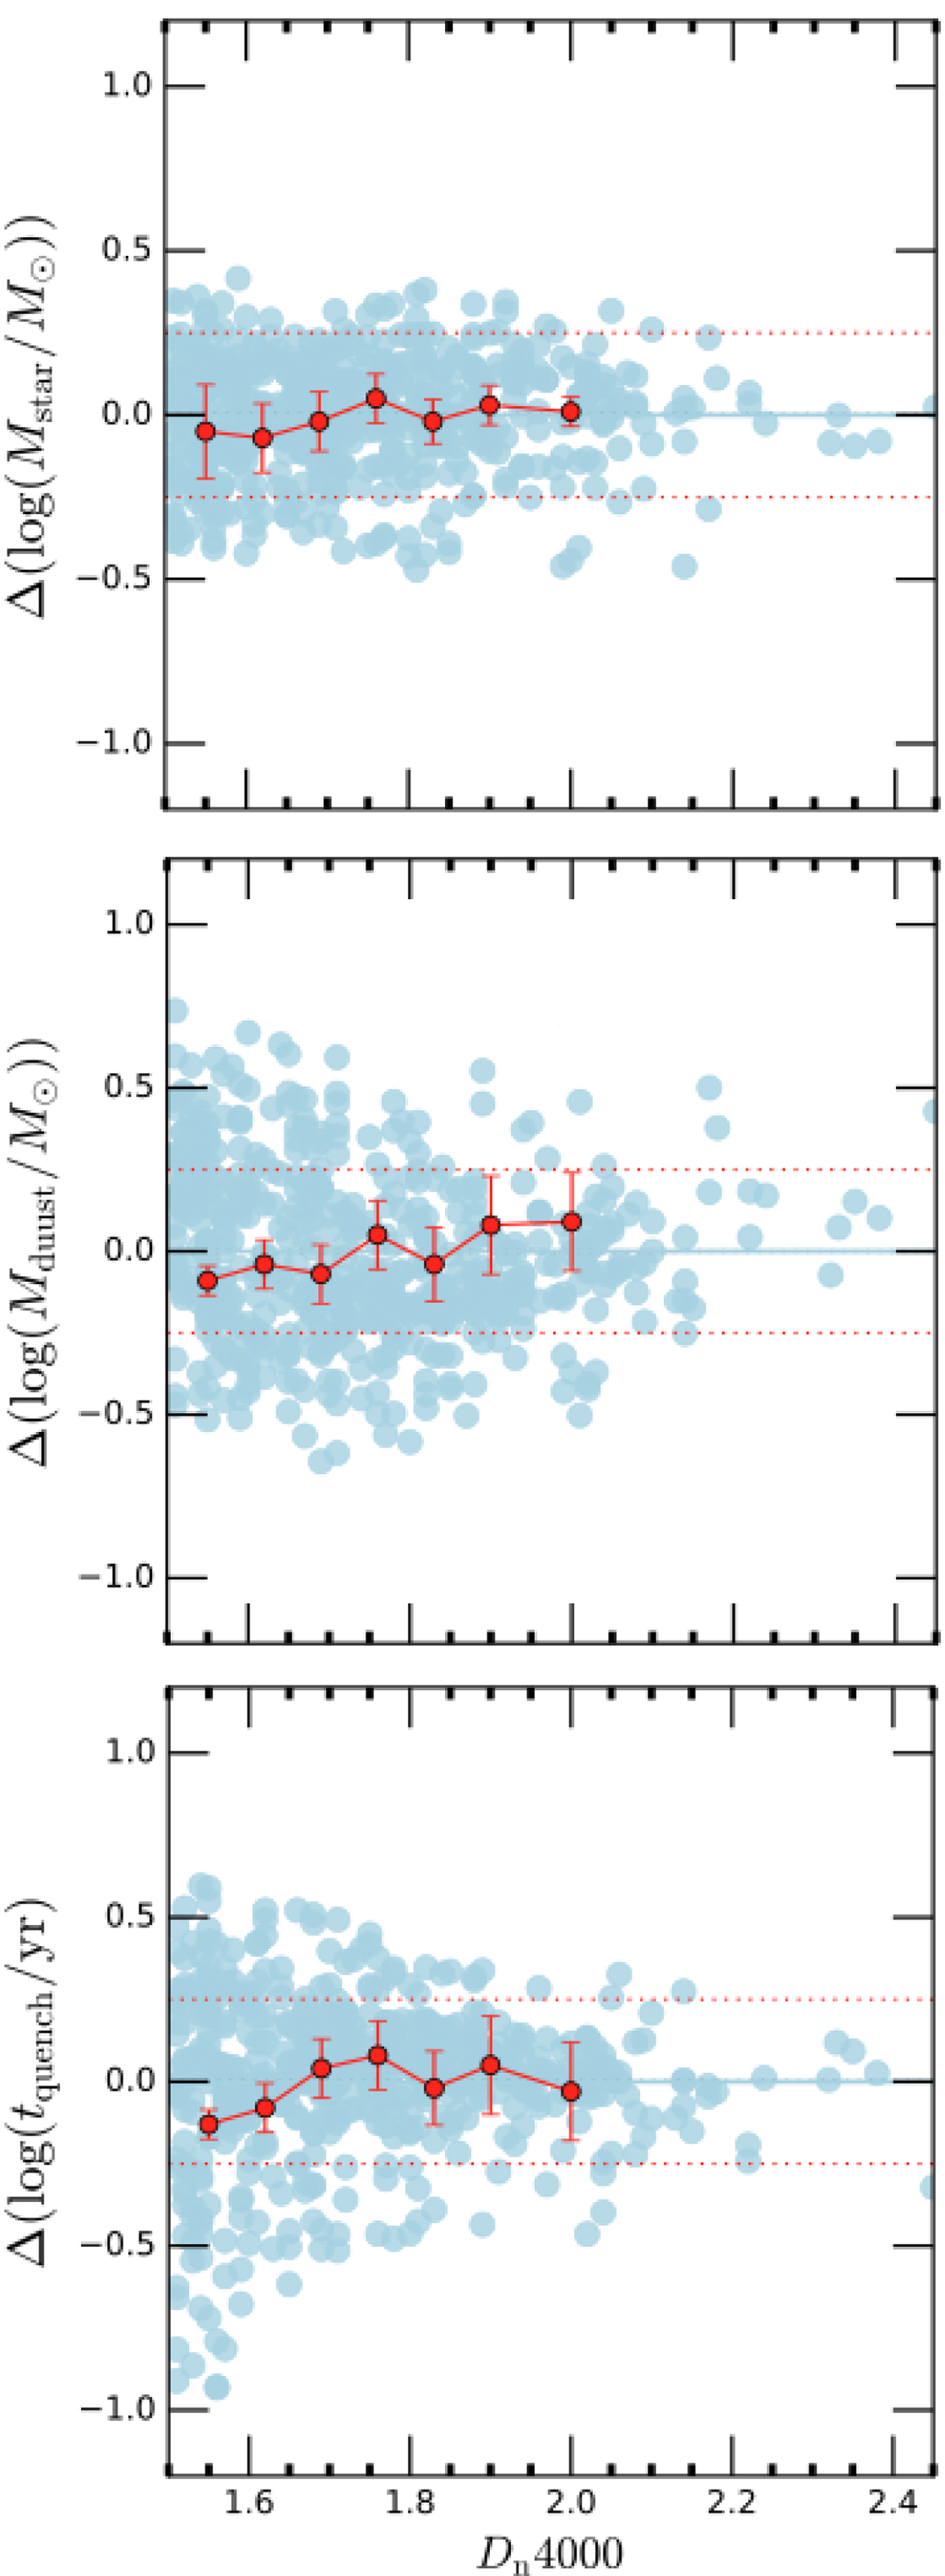
Fig. B.2.
Download original image
Results of our mock analysis where we quantify the difference between the input parameters used to build the simulated catalogue in CIGALE and results of the SED fitting of this mock catalogue. The offset between the simulated and ‘observed’ physical parameters with CIGALE is expressed on the y-axis in log scale. From top to bottom: Stellar mass, dust mass, and time since quenching modelled with use of a flexible SFH. The offset between the ‘true’ and ‘recovered’ values is evaluated as a function of input Dn4000 from simulated catalogues. We consider that a good constraint on a given parameter is obtained if the difference between the input and output approaches zero, which is indicated by the solid blue lines. The trends following the binned means are displayed with red circles with corresponding 1σ errors, while dotted red lines represent a 0.25 dex offset from zero. Our analysis shows a good overall agreement between the input and output values, even in simulated galaxies with higher Dn4000.
Current usage metrics show cumulative count of Article Views (full-text article views including HTML views, PDF and ePub downloads, according to the available data) and Abstracts Views on Vision4Press platform.
Data correspond to usage on the plateform after 2015. The current usage metrics is available 48-96 hours after online publication and is updated daily on week days.
Initial download of the metrics may take a while.