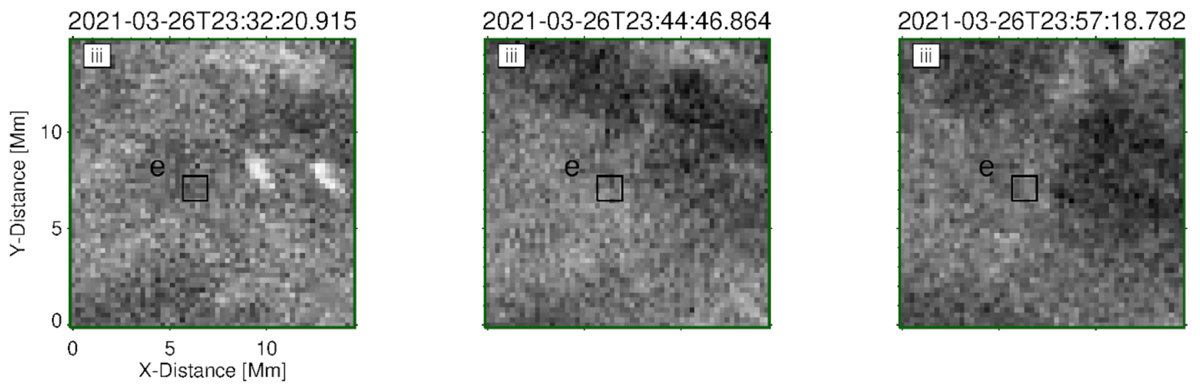
Fig. B.2.
Download original image
Snapshots of region with loop-like features without time averaging. This figure corresponds to Fig. 5. The snapshots are shown at three times, as indicated by the time stamps. Images are commonly scaled to the same minimum and maximum values of intensity. Box e has the same meaning as in Fig. B.1 (see Appendix B).
Current usage metrics show cumulative count of Article Views (full-text article views including HTML views, PDF and ePub downloads, according to the available data) and Abstracts Views on Vision4Press platform.
Data correspond to usage on the plateform after 2015. The current usage metrics is available 48-96 hours after online publication and is updated daily on week days.
Initial download of the metrics may take a while.