Fig. B.1.
Download original image
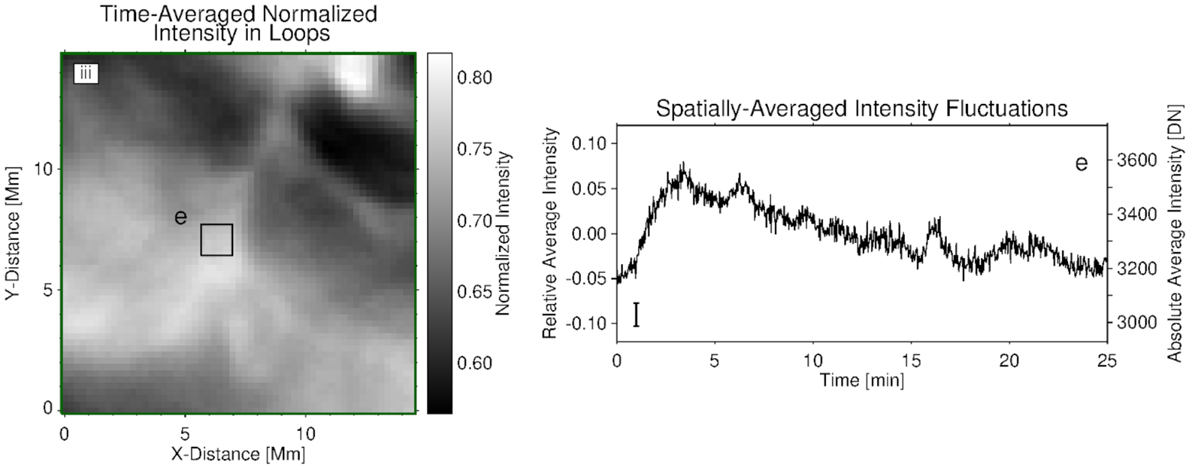
Intensity fluctuations in the region with loop-like features. The layout of this figure corresponds to Fig. 4. The left panel shows a zoomed-in image of the green box in Fig. 1b (region iii). Within this region a smaller sub-field e is outlined. This has the same area as the sub-fields in Fig. 4 i and ii. The spatially averaged relative (left y-axis) and absolute (right y-axis) intensity for sub-field e is plotted as a function of time in the right panel. The vertical bar represents the maximum error for the time series (see Appendix B).
Current usage metrics show cumulative count of Article Views (full-text article views including HTML views, PDF and ePub downloads, according to the available data) and Abstracts Views on Vision4Press platform.
Data correspond to usage on the plateform after 2015. The current usage metrics is available 48-96 hours after online publication and is updated daily on week days.
Initial download of the metrics may take a while.