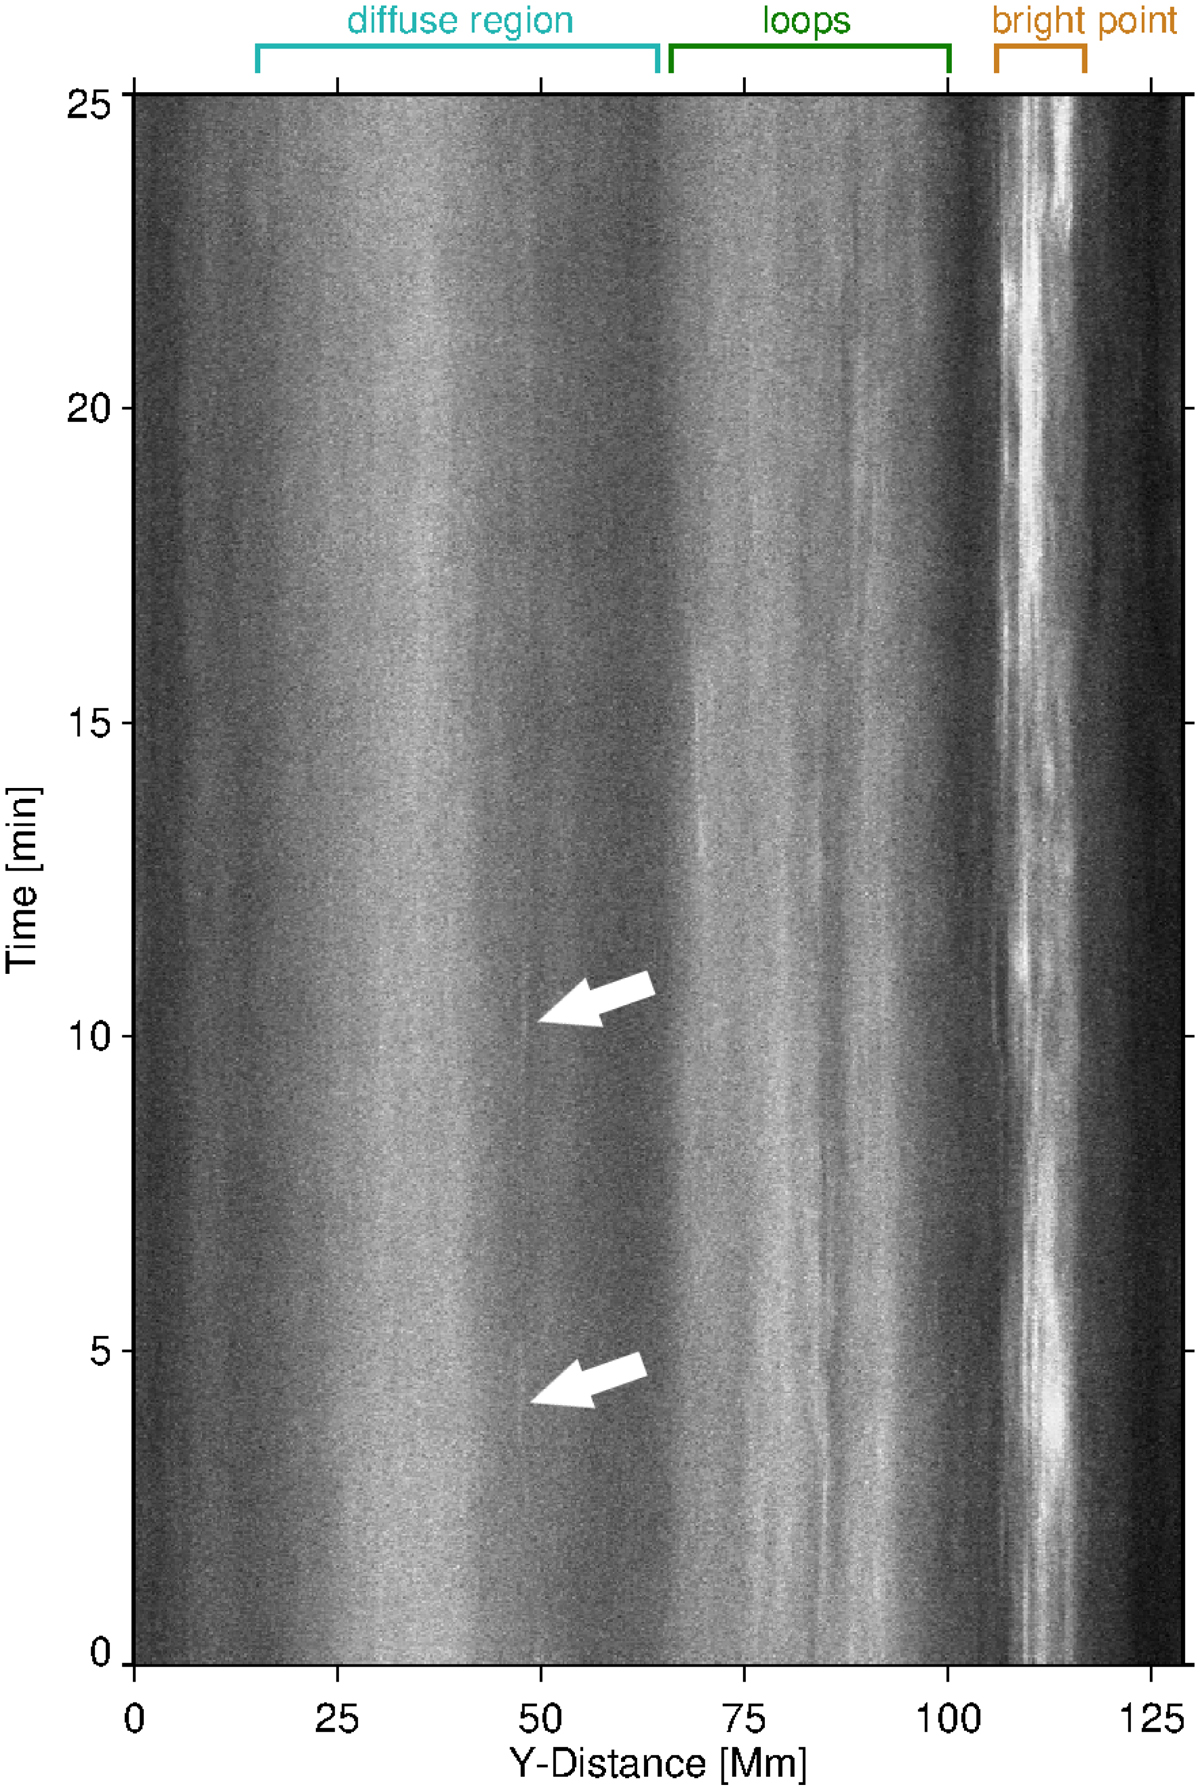
Fig. 2.
Download original image
Temporal evolution of cut through the diffuse region and coronal bright point. This time–distance plot shows the intensity in HRIEUV from along the cut (1 pixel in x) outlined by the black vertical line in Fig. 1b as it evolves over the entire 25 min observing time. The intensity is scaled linearly from 915 DN s−1 (black) to 2500 DN s−1 (white). Above the panel the location in the y direction of three types of regions are labeled. The two arrows indicate transient brightenings in the diffuse region (see Sects. 3.1 and 4.2).
Current usage metrics show cumulative count of Article Views (full-text article views including HTML views, PDF and ePub downloads, according to the available data) and Abstracts Views on Vision4Press platform.
Data correspond to usage on the plateform after 2015. The current usage metrics is available 48-96 hours after online publication and is updated daily on week days.
Initial download of the metrics may take a while.