Fig. B.3
Download original image
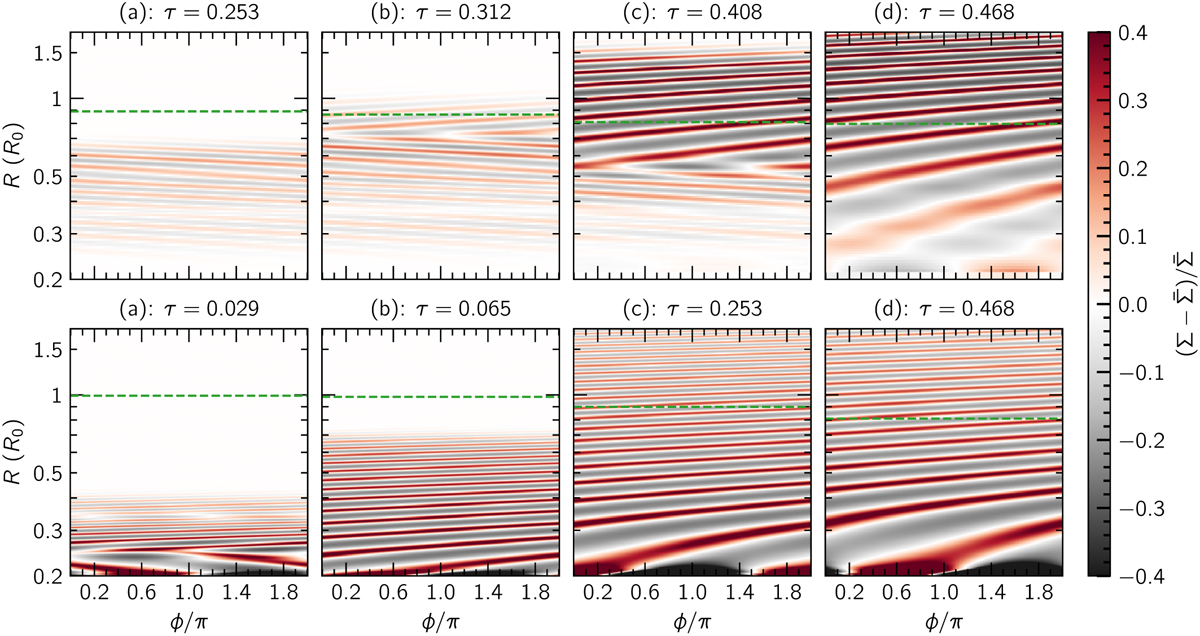
Surface density deviation heat maps similar to Fig. 3, but for FARGO simulations at a resolution of 256 × 256 on an arithmetic grid (top) and at 456 × 256 on a logarithmic grid (bottom). Top: Setup that reproduces the results of SK03 (see Fig. 6 therein). The flip from a leading to trailing spiral is visible in the middle two panels, before it disappears into a single leading spiral. Bottom: Setup that is equivalent to our fiducial PLUTO model, and behaves very similar to our results in Fig. 3. Here, spirals develop earlier and the initial flip is short-lived and closer to the inner boundary.
Current usage metrics show cumulative count of Article Views (full-text article views including HTML views, PDF and ePub downloads, according to the available data) and Abstracts Views on Vision4Press platform.
Data correspond to usage on the plateform after 2015. The current usage metrics is available 48-96 hours after online publication and is updated daily on week days.
Initial download of the metrics may take a while.