Fig. 9.
Download original image
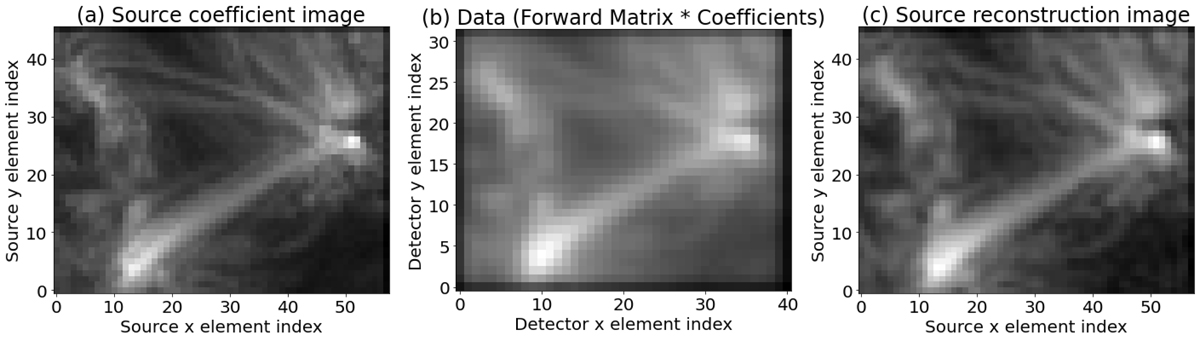
Reconstruction of the two-dimensional example case previously shown in Fig. 6 using our method. Panel a: Original “source” model. Panel b: Data corresponding to source model (including PSF, pixelization, and noise). Panel c: Reconstruction of the source model.
Current usage metrics show cumulative count of Article Views (full-text article views including HTML views, PDF and ePub downloads, according to the available data) and Abstracts Views on Vision4Press platform.
Data correspond to usage on the plateform after 2015. The current usage metrics is available 48-96 hours after online publication and is updated daily on week days.
Initial download of the metrics may take a while.