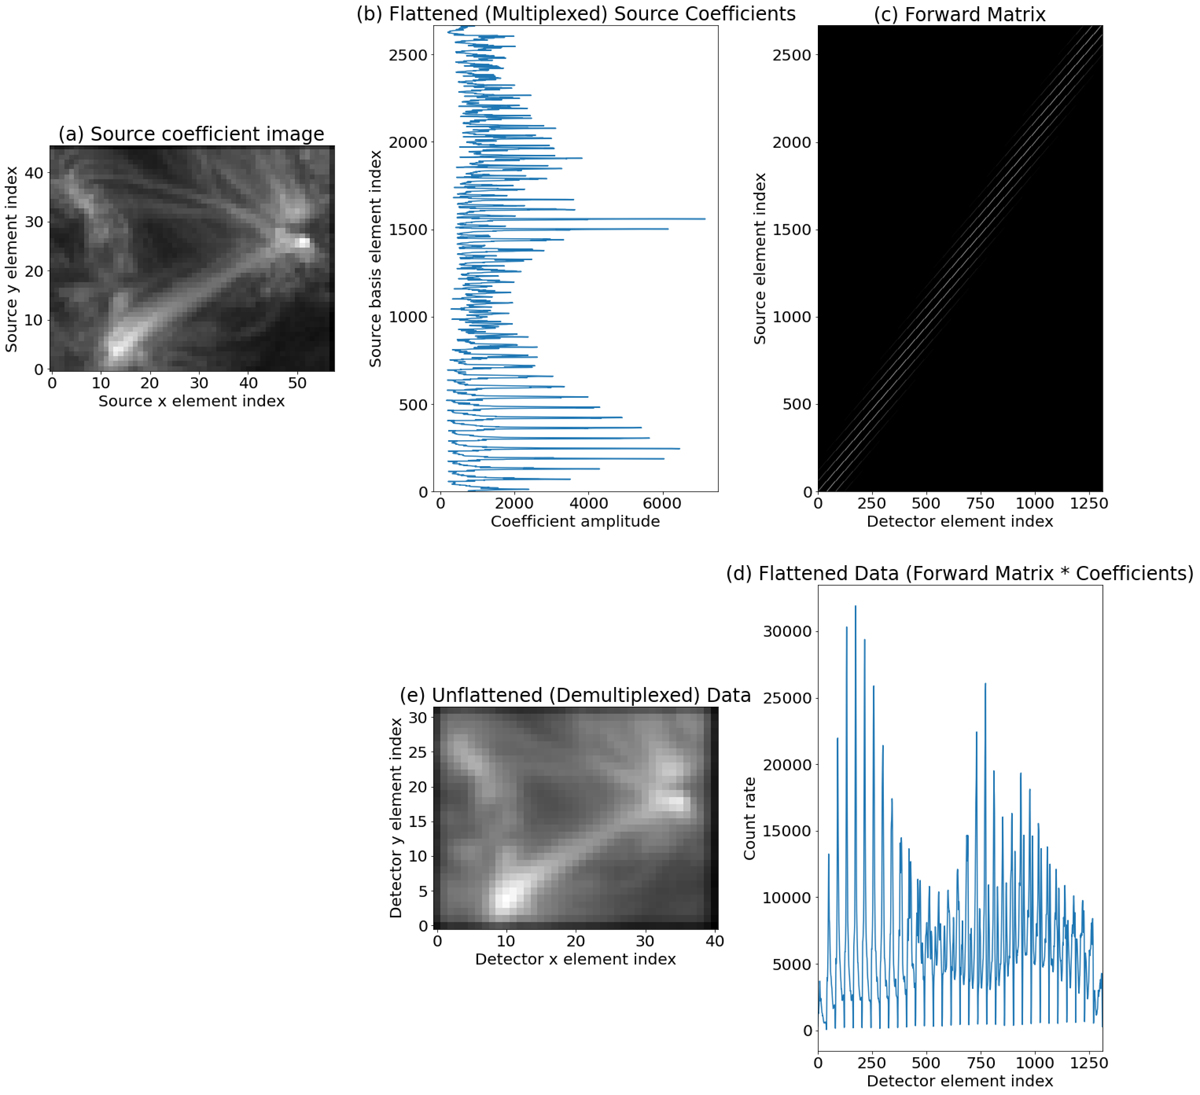
Fig. 7.
Download original image
Two-dimensional example of the linear process applied using a matrix in a single step. The input source coefficient image (panel a) and outputs (detector count rates image; panel e) in this figure are identical to Fig. 6, but all the intermediate operations were carried out by a single matrix (shown as an image at top right; panel c). The vertical axis of this matrix is aligned with the source element index, while the horizontal axis is aligned with the detector element index. This two-dimensional case is equivalent to the 1D example except that there is a multiplexing step that “flattens” the 2D input to 1D (panel b) prior to multiplication by the forward matrix (top right). The result of this multiplication (panel d) can then be demultiplexed to produce the output image (panel e).
Current usage metrics show cumulative count of Article Views (full-text article views including HTML views, PDF and ePub downloads, according to the available data) and Abstracts Views on Vision4Press platform.
Data correspond to usage on the plateform after 2015. The current usage metrics is available 48-96 hours after online publication and is updated daily on week days.
Initial download of the metrics may take a while.