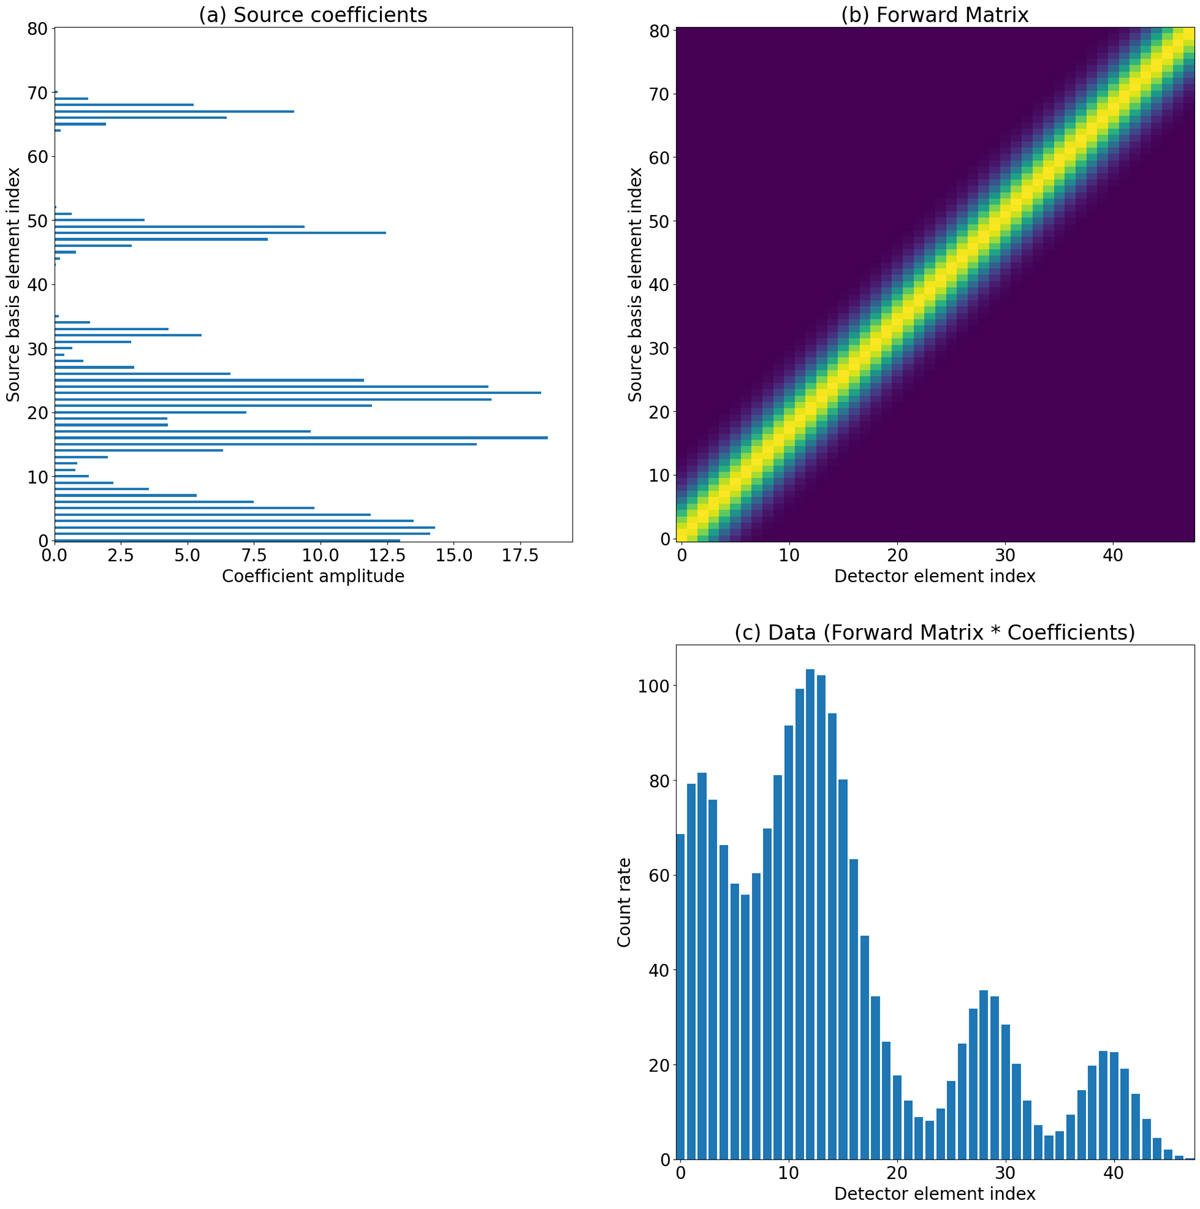
Fig. 5.
Download original image
One-dimensional example of the linear process applied using a matrix in a single step. Input (source coefficients; panel a) and outputs (detector count rates; panel c) in this figure are identical to Fig. 4 but with all of the intermediate operations carried out by a single matrix (panel b). This figure is specifically constructed so that the vertical axis of the matrix is aligned with the source element index, while the horizontal axis is aligned with the detector element index in order to make the matrix nature of the operation visually apparent.
Current usage metrics show cumulative count of Article Views (full-text article views including HTML views, PDF and ePub downloads, according to the available data) and Abstracts Views on Vision4Press platform.
Data correspond to usage on the plateform after 2015. The current usage metrics is available 48-96 hours after online publication and is updated daily on week days.
Initial download of the metrics may take a while.