Fig. 4.
Download original image
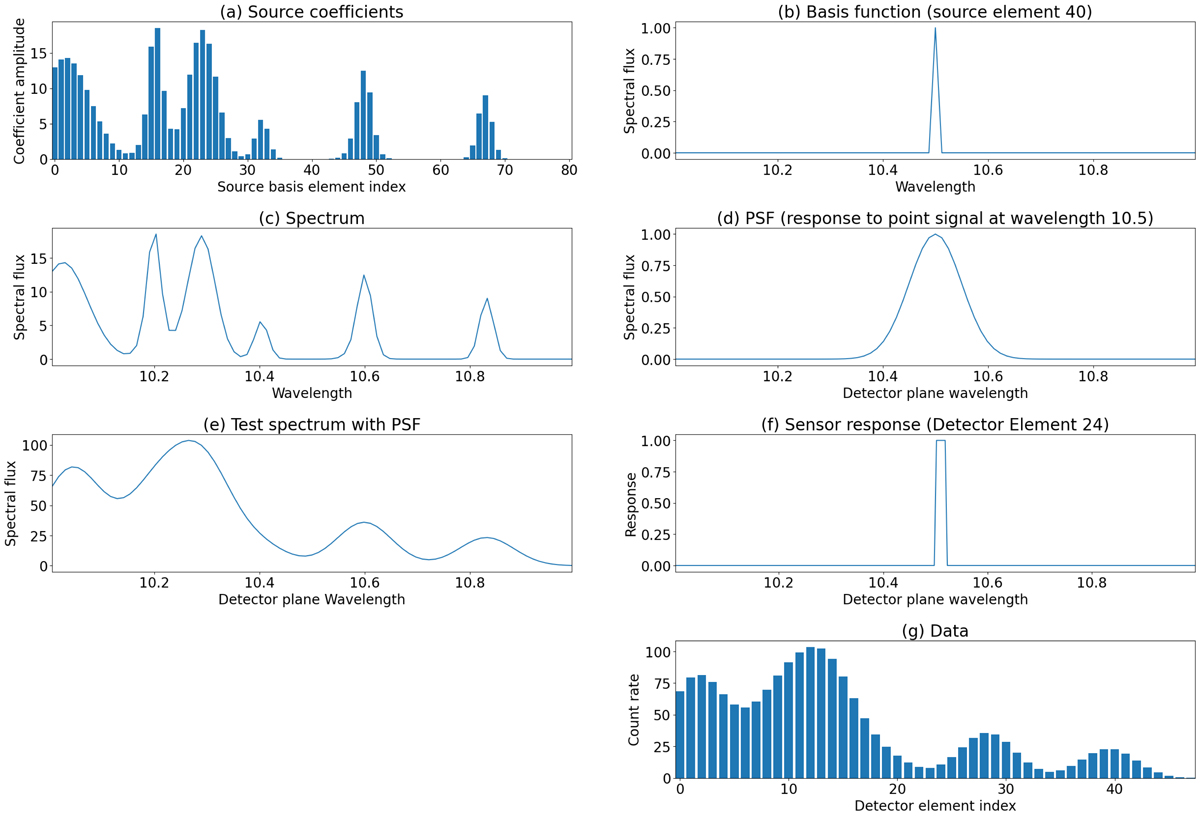
One-dimensional example of the linear process relating a source model to observations. The input to the model (panel a) is a set of coefficients. These are multiplied by a set of basis functions at various wavelengths (one is shown in panel b), and the result is added to produce a spectrum (panel c). The spectrum in turn is multiplied by the PSF at each wavelength (panel d), and the result is added to produce a detector plane spectrum (panel e). Lastly, each of the sensor response functions (panel f) are integrated against the detector plane spectrum to produce count rates in each detector element (panel g).
Current usage metrics show cumulative count of Article Views (full-text article views including HTML views, PDF and ePub downloads, according to the available data) and Abstracts Views on Vision4Press platform.
Data correspond to usage on the plateform after 2015. The current usage metrics is available 48-96 hours after online publication and is updated daily on week days.
Initial download of the metrics may take a while.