Fig. 16.
Download original image
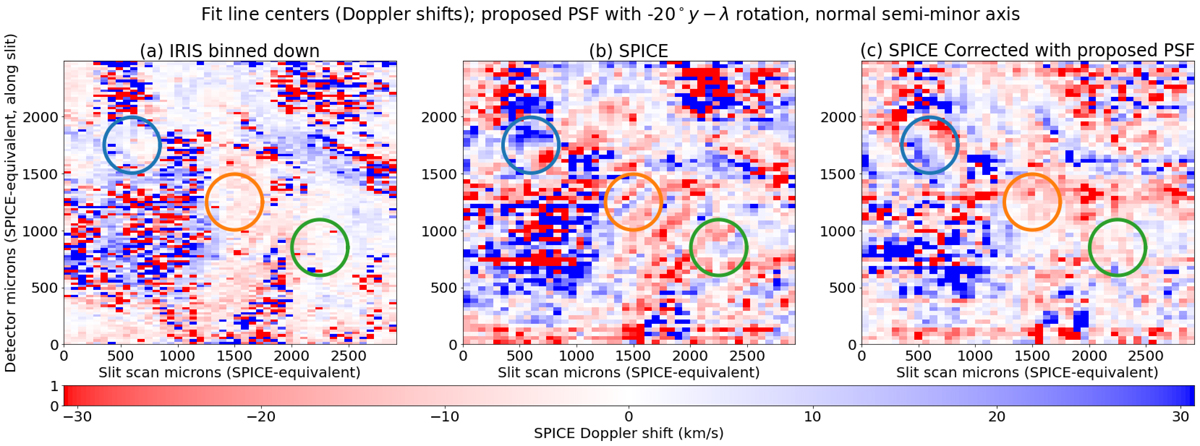
Doppler shifts for a second region (see Fig. 15 for context) of the coordinated SPICE and IRIS observations. Panel a: IRIS data. Panel b: SPICE data. Panel c: Corrected SPICE data. This second region has a lower signal compared to the first region and a small, highly complex region (blue circle at top left of each image) that shows a strong (likely artifact) feature in SPICE but not in IRIS. Generally, the correction removes the artifacts, although the agreement with IRIS is less strong than in the first region (Fig. 13). See text for further discussion.
Current usage metrics show cumulative count of Article Views (full-text article views including HTML views, PDF and ePub downloads, according to the available data) and Abstracts Views on Vision4Press platform.
Data correspond to usage on the plateform after 2015. The current usage metrics is available 48-96 hours after online publication and is updated daily on week days.
Initial download of the metrics may take a while.