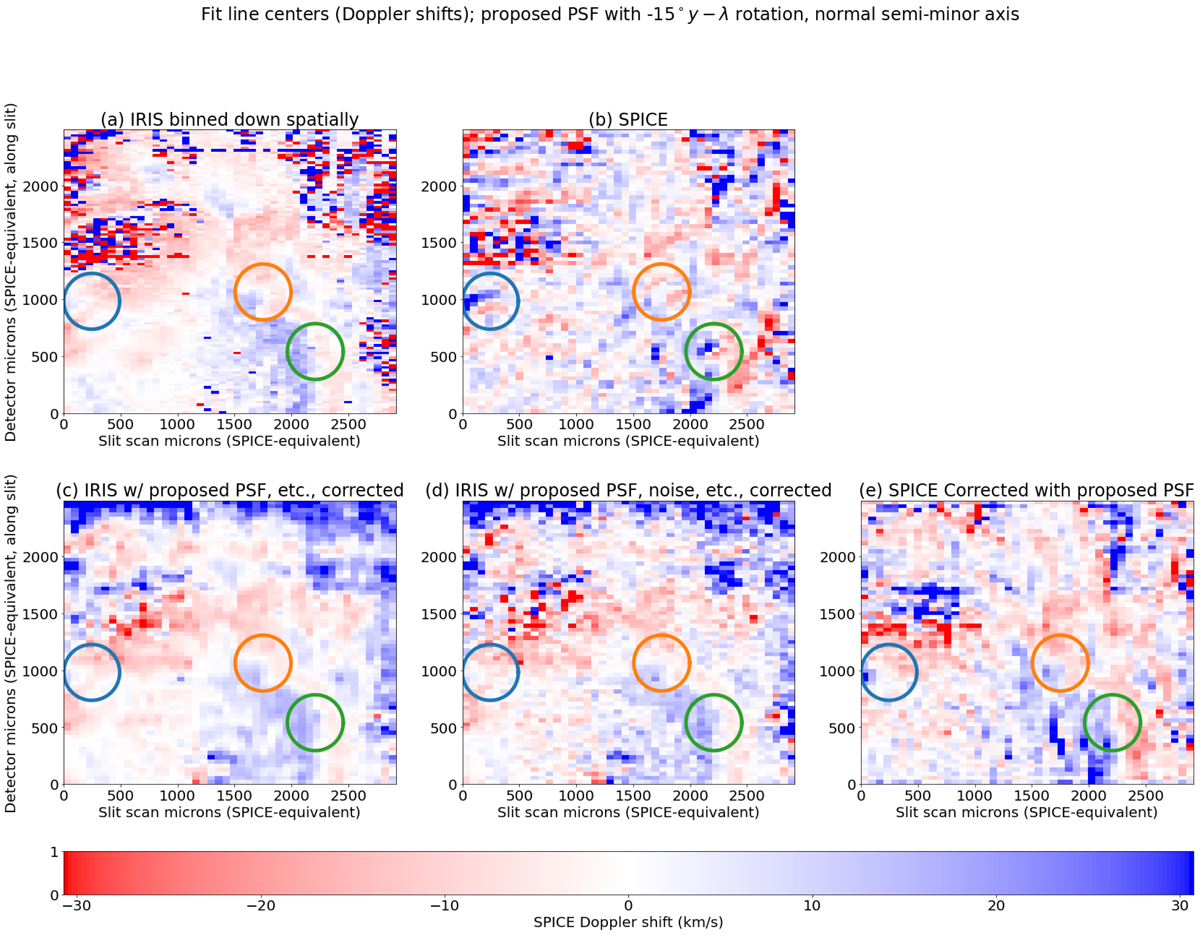
Fig. 13.
Download original image
Corrected Doppler shifts for both the degraded IRIS data and the SPICE data. Panel a: Binned down IRIS data. Panel b: Original SPICE data (for comparison). Panel c: Degraded, then corrected IRIS Doppler data. The data shown is essentially identical to the original (with down binning) IRIS data, which demonstrates that the correction is formally sound. Panel d: Degraded, noise added, and then corrected IRIS data. The read noise data were set to 0.75 SPICE L2 data units, while the shot noise data were both set to 0.75 SPICE L2 data units times the square root of the data level at each pixel. Panel e: Corrected SPICE data. The data looks very similar to the degraded, noise added IRIS data (for the degraded IRIS data, see Fig. 3). This demonstrates that the correction also works on the real SPICE data.
Current usage metrics show cumulative count of Article Views (full-text article views including HTML views, PDF and ePub downloads, according to the available data) and Abstracts Views on Vision4Press platform.
Data correspond to usage on the plateform after 2015. The current usage metrics is available 48-96 hours after online publication and is updated daily on week days.
Initial download of the metrics may take a while.