Fig. 11.
Download original image
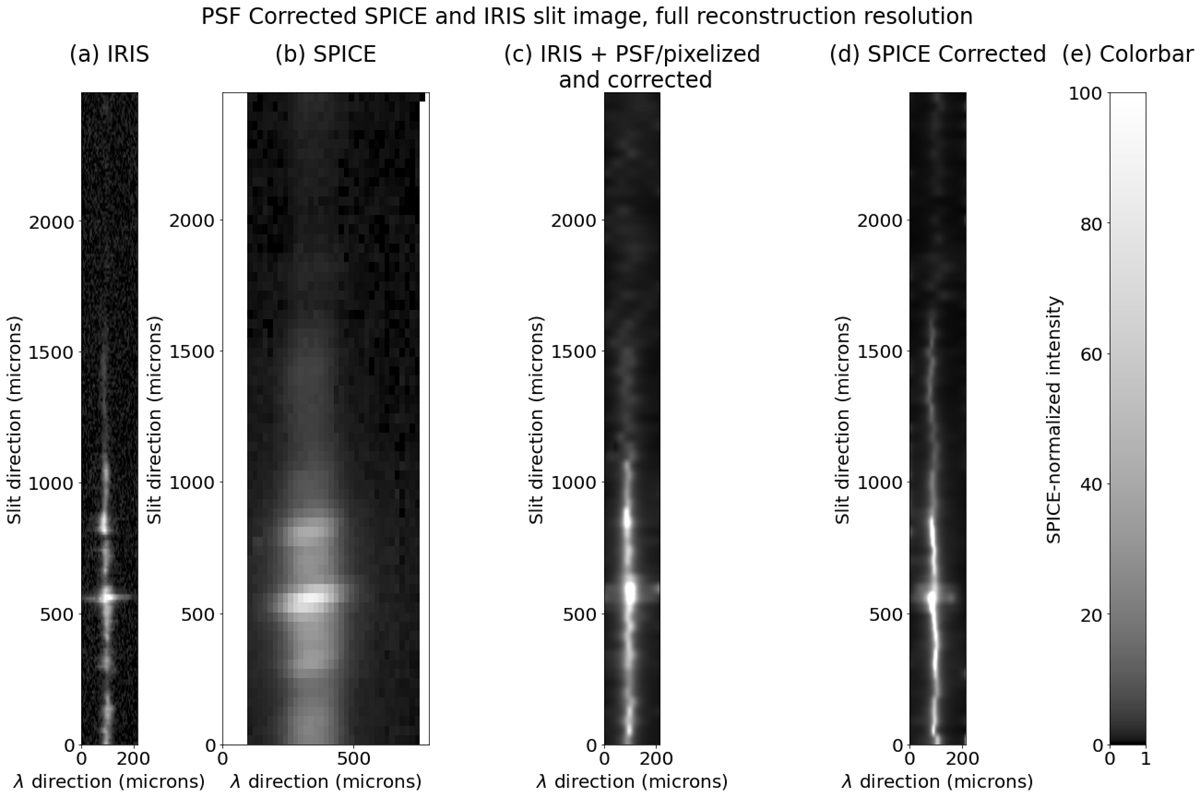
High-resolution “raw” corrected spectra from the same slit position as shown in Fig. 2. Panel a: IRIS data. Panel b: SPICE data. Panel c: Correction applied to the degraded IRIS data. Panel d: Correction applied to SPICE data. The last two panels are at a higher spectral resolution than the input SPICE data. The higher resolution was necessary to resolve the spectral line. This over-resolution results in some noise-induced ringing and other ripples in the SPICE data, which we resolved by returning the image to SPICE pixel scale plus a “nominal” PSF, shown in Fig. 12. Otherwise, the original IRIS line width was recovered, while the elongation and tilt of the SPICE PSF was removed.
Current usage metrics show cumulative count of Article Views (full-text article views including HTML views, PDF and ePub downloads, according to the available data) and Abstracts Views on Vision4Press platform.
Data correspond to usage on the plateform after 2015. The current usage metrics is available 48-96 hours after online publication and is updated daily on week days.
Initial download of the metrics may take a while.