Fig. 1.
Download original image
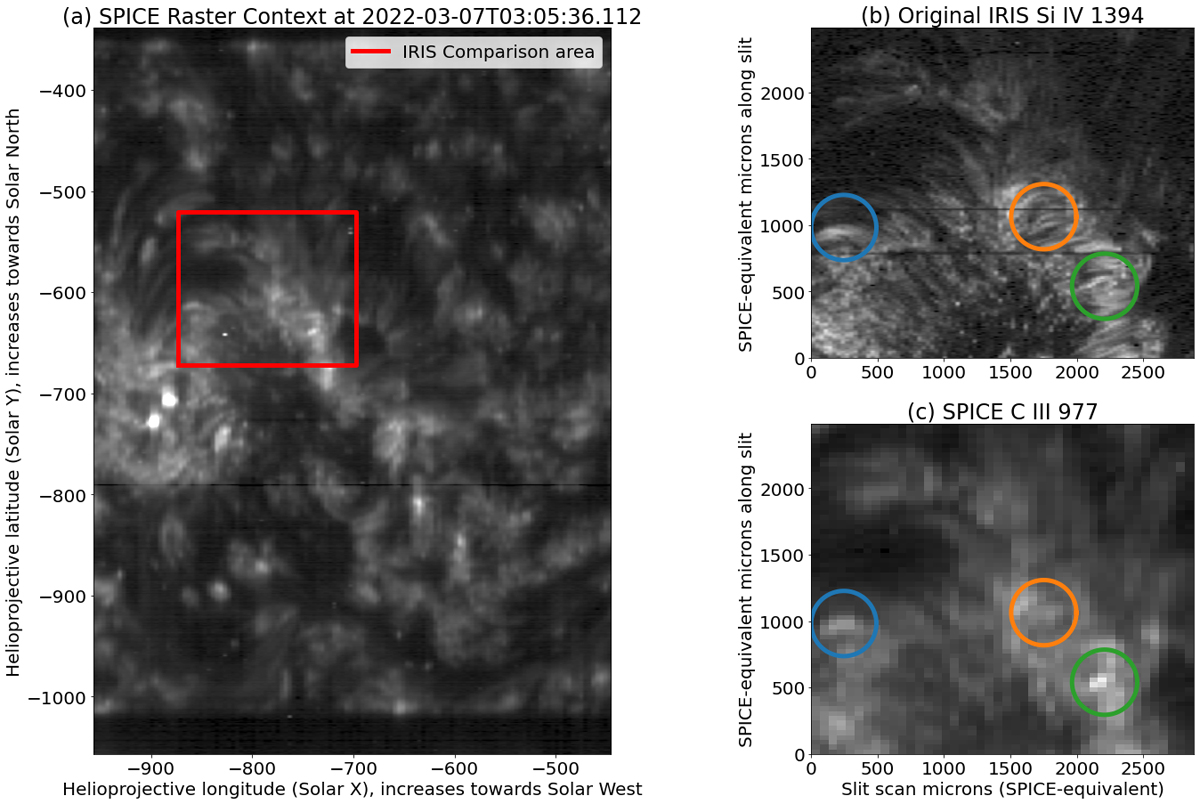
Context images of the primary IRIS and SPICE observations used for demonstration and testing in this paper. Left panel a: Context image of the SPICE-IRIS coordinated observation data. The image was made from one of the full-size SPICE rasters. It is a spectral sum over the C III 977 Å window. The detailed comparisons in this paper focus on the smaller region outlined in this image. Upper-right panel b: Spectral line fit amplitude image of the smaller region from IRIS. Lower-right panel c: Spectral line fit amplitude image of the smaller region from SPICE.
Current usage metrics show cumulative count of Article Views (full-text article views including HTML views, PDF and ePub downloads, according to the available data) and Abstracts Views on Vision4Press platform.
Data correspond to usage on the plateform after 2015. The current usage metrics is available 48-96 hours after online publication and is updated daily on week days.
Initial download of the metrics may take a while.