Fig. A.1
Download original image
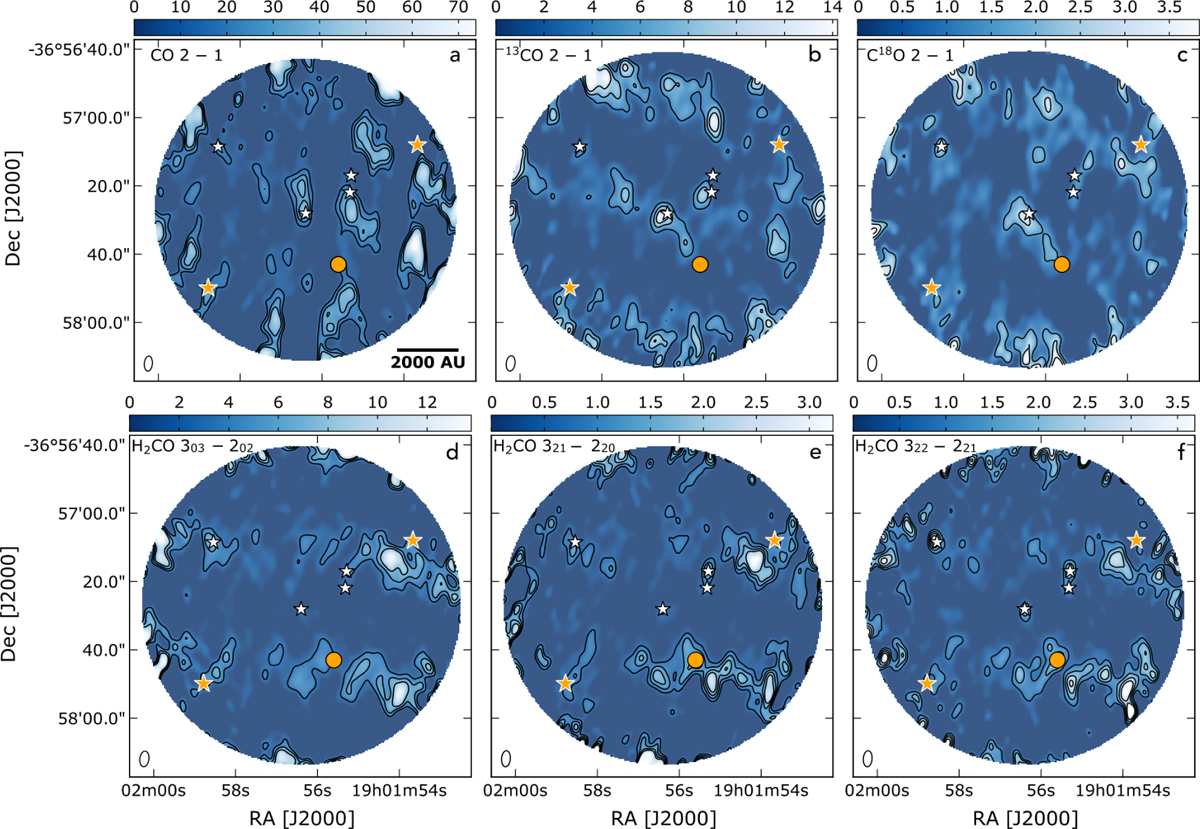
Primary beam corrected integrated intensity maps in Jy beam−1km s−1 for the different species detected with the SMA. In each plot contours start at 5σ and continue in intervals of 5σ, except for panel a-c for which contours start at 10σ and continue in intervals of 10σ. Shown are (a) CO J = 2 − 1 (σ= 0.96 Jy beam−1km s−1), (b) 13CO J = 2 − 1 (σ= 0.32 Jy beam−1km s−1 ), (b) C18O J = 2 − 1 (σ= 0.13 Jy beam−1km s−1), (d) H2CO 303 − 202 (σ= 0.23 mJy beam−1km s−1), (e) H2CO 321−220 (σ= 88 mJy beam−1km s−1), (f) H2CO 322 − 221 (σ= 0.14 mJy beam−1km s−1). The circular field-of-view corresponds to the SMA primary beam. The size of the synthesised beam is shown in the lower left corner of each image. The white and orange stars and the orange circle mark the position of the Coronet cluster members as in Fig. 1.
Current usage metrics show cumulative count of Article Views (full-text article views including HTML views, PDF and ePub downloads, according to the available data) and Abstracts Views on Vision4Press platform.
Data correspond to usage on the plateform after 2015. The current usage metrics is available 48-96 hours after online publication and is updated daily on week days.
Initial download of the metrics may take a while.