Fig. 5
Download original image
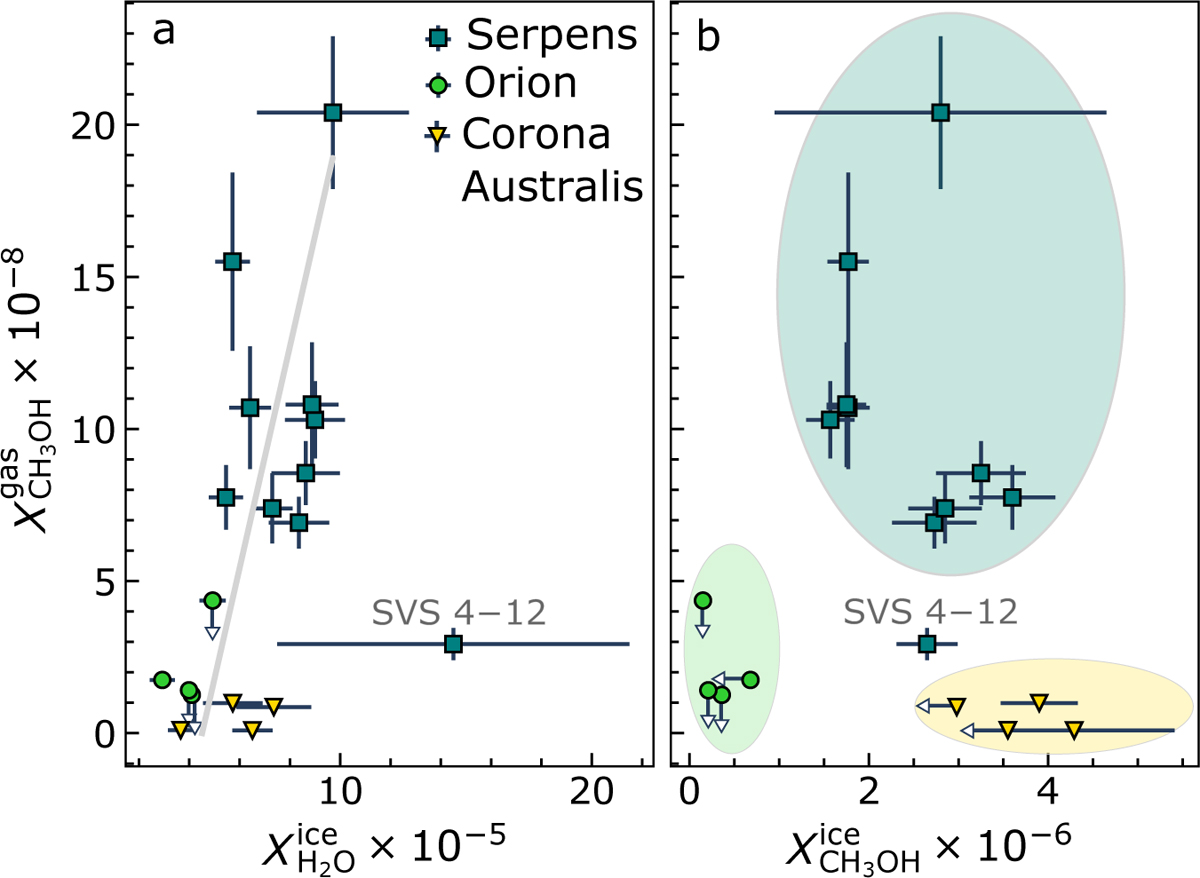
Relationship between CH3OH and H2O fractional abundances (X) towards three nearby low-mass star-forming regions. The triangles represent the gas and ice fractional abundances relative to H2 for the Coronet cluster members listed in Table 3 for which both gas and ice measurements are available. The squares and circles symbolise the values obtained for Serpens SVS 4 and Orion B35A from Perotti et al. (2020, 2021), respectively. The CH3OH gas abundances are compared to the H2O (panel a) and CH3OH (panel b) ice abundances. Upper limits are marked as empty arrows. The grey line in panel a represents the linear fit to the detections. In panel b three different groups are identified, excluding Serpens SVS 4–12; they correspond to the three star-forming regions and they are marked with coloured ovals.
Current usage metrics show cumulative count of Article Views (full-text article views including HTML views, PDF and ePub downloads, according to the available data) and Abstracts Views on Vision4Press platform.
Data correspond to usage on the plateform after 2015. The current usage metrics is available 48-96 hours after online publication and is updated daily on week days.
Initial download of the metrics may take a while.